Mukka Proteins Reports Strong Q3 FY26 Performance with Revenue of ₹653.50 Crore


Mukka Proteins Limited reported exceptional Q3 FY26 results with consolidated revenue of ₹653.50 crore, up 115.57% YoY, and EBITDA of ₹53.21 crore with 8.14% margins. Nine-month revenue reached ₹1,068.85 crore, growing 71.06% compared to previous year. The company secured a major ₹474.89 crore order for leachate treatment from BSWML and expanded its carbon credit operations with Verra-listed BSF project approval for 1,000 TPD capacity.

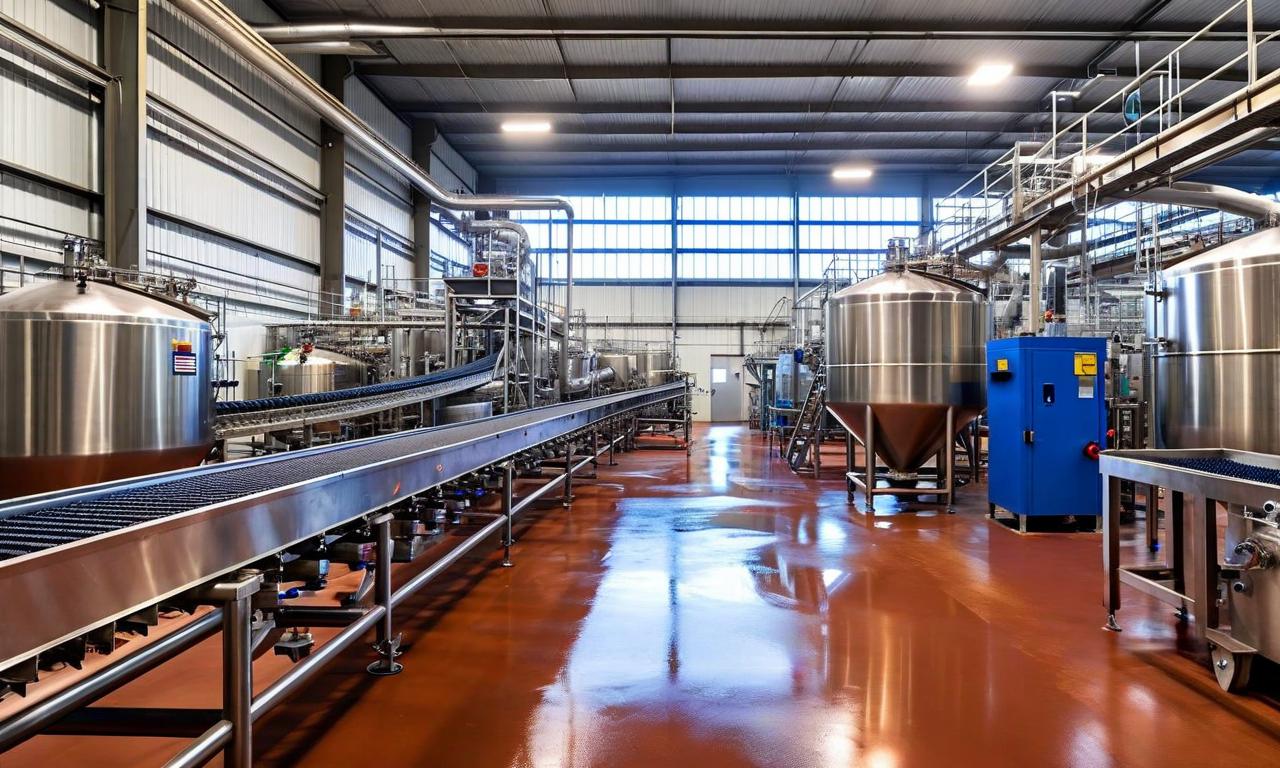
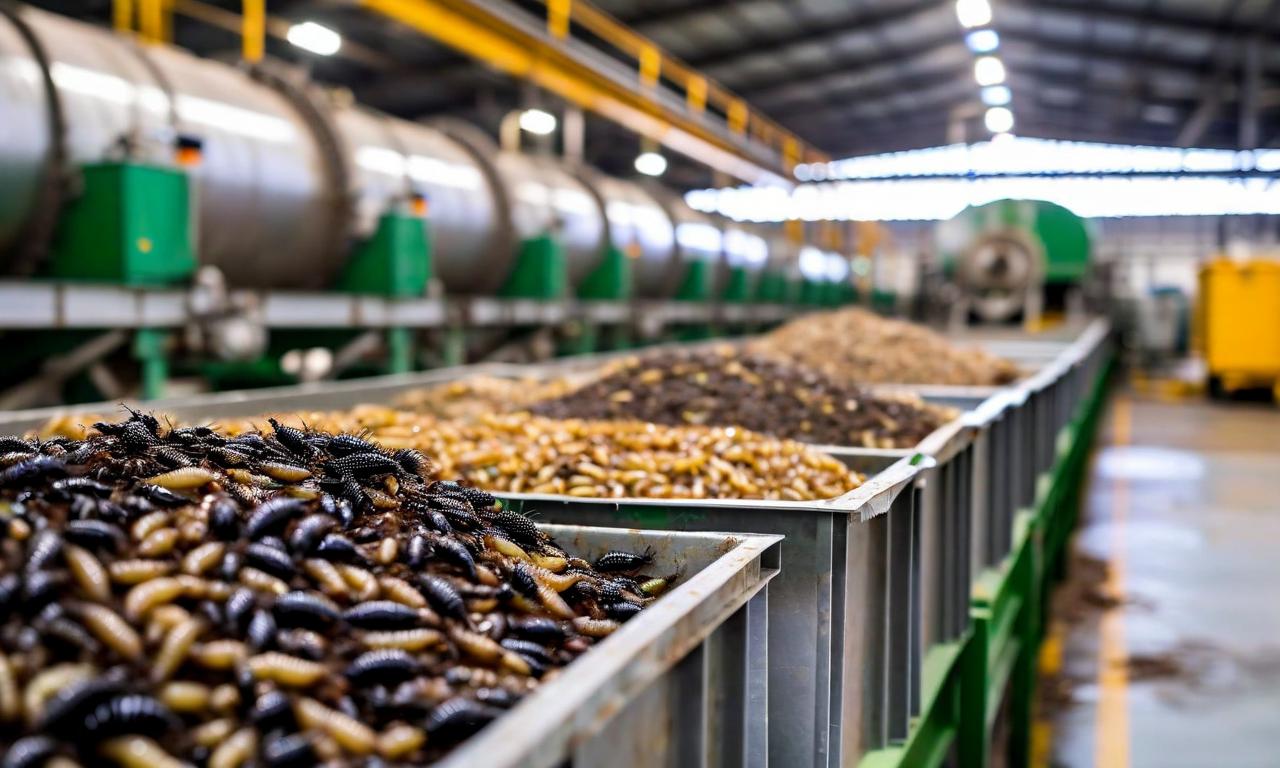
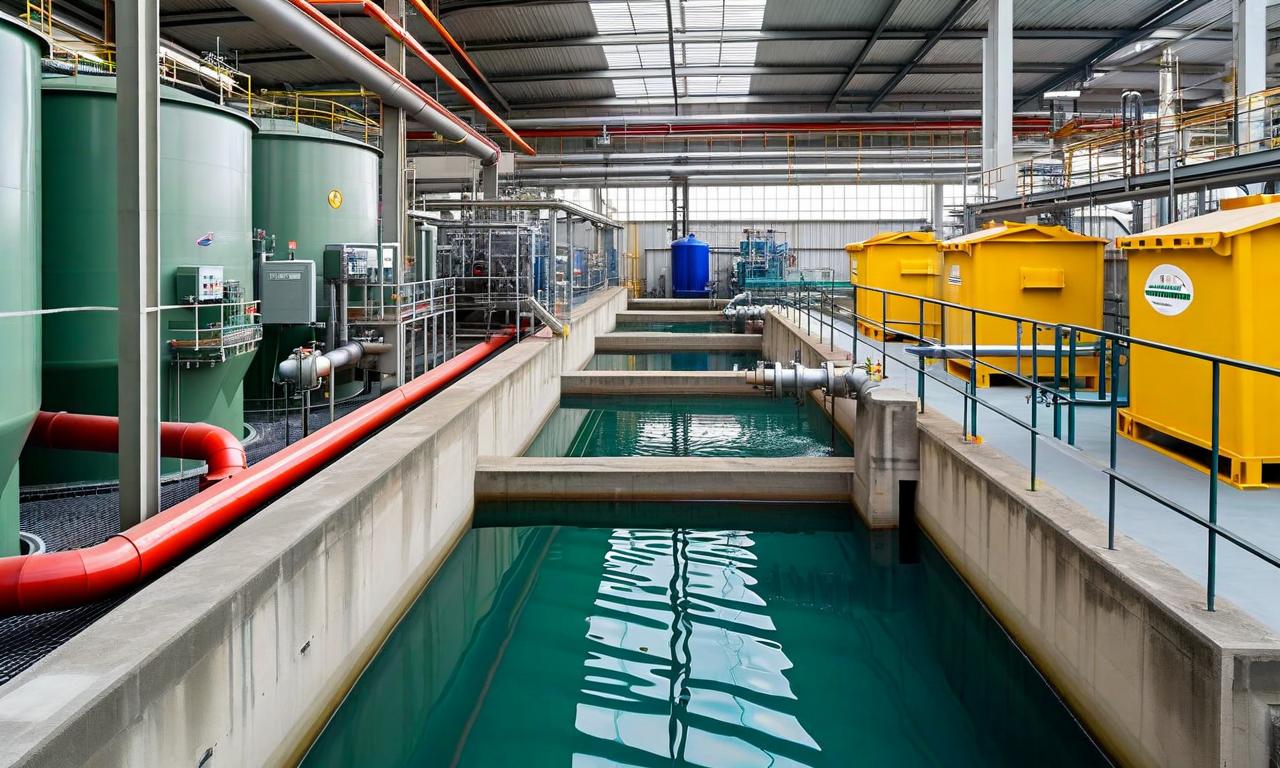
*this image is generated using AI for illustrative purposes only.
Mukka proteins Limited, one of India's prominent manufacturers and exporters of fishmeal, fish oil, and fish-soluble paste, announced strong unaudited financial results for the quarter and nine months ended December 31, 2025. The company demonstrated exceptional growth momentum with revenue more than doubling year-on-year while securing significant new business opportunities in waste management solutions.
Financial Performance Highlights
The company's consolidated financial performance for Q3 FY26 showed remarkable growth across key metrics. Revenue from operations reached ₹653.50 crore, representing a substantial increase of 115.57% compared to Q3 FY25 and 167.19% quarter-on-quarter growth.
| Particulars | Q3 FY26 | Q3 FY25 | Y-o-Y% | Q2 FY26 | Q-o-Q% |
|---|---|---|---|---|---|
| Revenue from operations (₹ Cr) | 653.50 | 303.15 | 115.57% | 244.58 | 167.19% |
| EBITDA (₹ Cr) | 53.21 | 47.67 | 11.61% | 26.28 | 102.50% |
| EBITDA Margin | 8.14% | 15.73% | - | 10.74% | - |
| PAT (₹ Cr) | 27.25 | 26.80 | 1.69% | 6.88 | 295.89% |
| PAT Margin | 4.17% | 8.84% | - | 2.81% | - |
Nine-Month Performance Overview
For the nine-month period FY26, the company maintained strong growth trajectory with consolidated revenue reaching ₹1,068.85 crore compared to ₹624.84 crore in 9M FY25, marking a 71.06% year-on-year increase. EBITDA for the period stood at ₹96.15 crore with margins at 9.00%, while PAT reached ₹35.73 crore with margins at 3.34%.
| Nine-Month Metrics | 9M FY26 | 9M FY25 | Y-o-Y% |
|---|---|---|---|
| Revenue from operations (₹ Cr) | 1,068.85 | 624.84 | 71.06% |
| EBITDA (₹ Cr) | 96.15 | 78.65 | 22.24% |
| EBITDA Margin | 9.00% | 12.59% | - |
| PAT (₹ Cr) | 35.73 | 34.10 | 4.78% |
| PAT Margin | 3.34% | 5.46% | - |
Strategic Business Developments
Mukka Proteins secured a significant order worth ₹474.89 crore from Bengaluru Solid Waste Management Limited for the scientific treatment of legacy leachate. This first-of-its-kind order represents strategic diversification into large-scale leachate treatment segment, expanding the company's waste-to-value solutions portfolio.
| Order Details | Specifications |
|---|---|
| Order Value | ₹474.89 crore |
| Client | Bengaluru Solid Waste Management Limited |
| Service Type | Scientific treatment of legacy leachate |
| Strategic Impact | Diversification into large-scale treatment segment |
ESG and Sustainability Initiatives
The company strengthened its carbon credit portfolio with significant developments in its BSF-driven wet-waste processing operations. The existing 300 TPD wet-waste processing operations, currently active under empanelment with Bengaluru Solid Waste Management Limited, are now formally listed on Verra Registry. Additionally, the company received incremental approval for expanding capacity to 1,000 TPD operations, advancing toward carbon credit issuance.
Management Commentary
CEO & MD Kalandan Mohammed Haris highlighted the company's strong performance and strategic progress. He emphasized the sharp revenue growth of 115.57% year-on-year for Q3 FY26, reaching ₹653.50 crore, and noted the company's strategic investments to expand scale and improve operating efficiency. These include increasing stakes to 100% in both Haris Marine Products Pvt. Ltd. and Ento Proteins Pvt. Ltd., alongside other strategic acquisitions to strengthen the platform for future expansion. The management aims to sustain momentum by benefiting from global fishmeal supply tightness while driving cost-optimization initiatives to enhance profitability.
Historical Stock Returns for Mukka Proteins
| 1 Day | 5 Days | 1 Month | 6 Months | 1 Year | 5 Years |
|---|---|---|---|---|---|
| -0.56% | -1.96% | -7.85% | +12.47% | -22.58% | -45.56% |
 20
20