Kamdhenu Limited Reports Record Q3FY26 Profitability with 67% Net Profit Jump


Kamdhenu Limited reported exceptional Q3FY26 results with net profit surging 67% to ₹20.8 crore and achieving record PBT margins of 15.9%. The company's asset-light franchise model drove strong performance with franchise volumes up 18% and royalty income growing 29%, demonstrating operational efficiency despite revenue headwinds from metal price fluctuations.
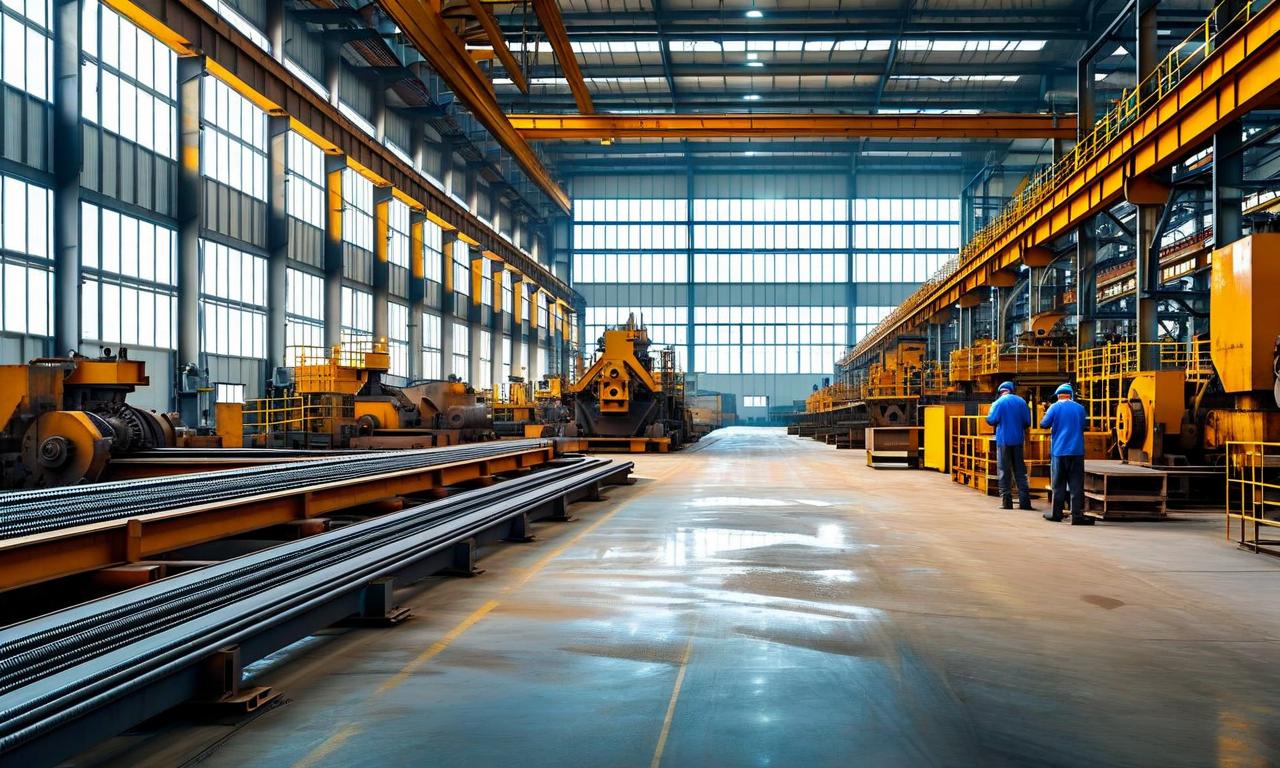

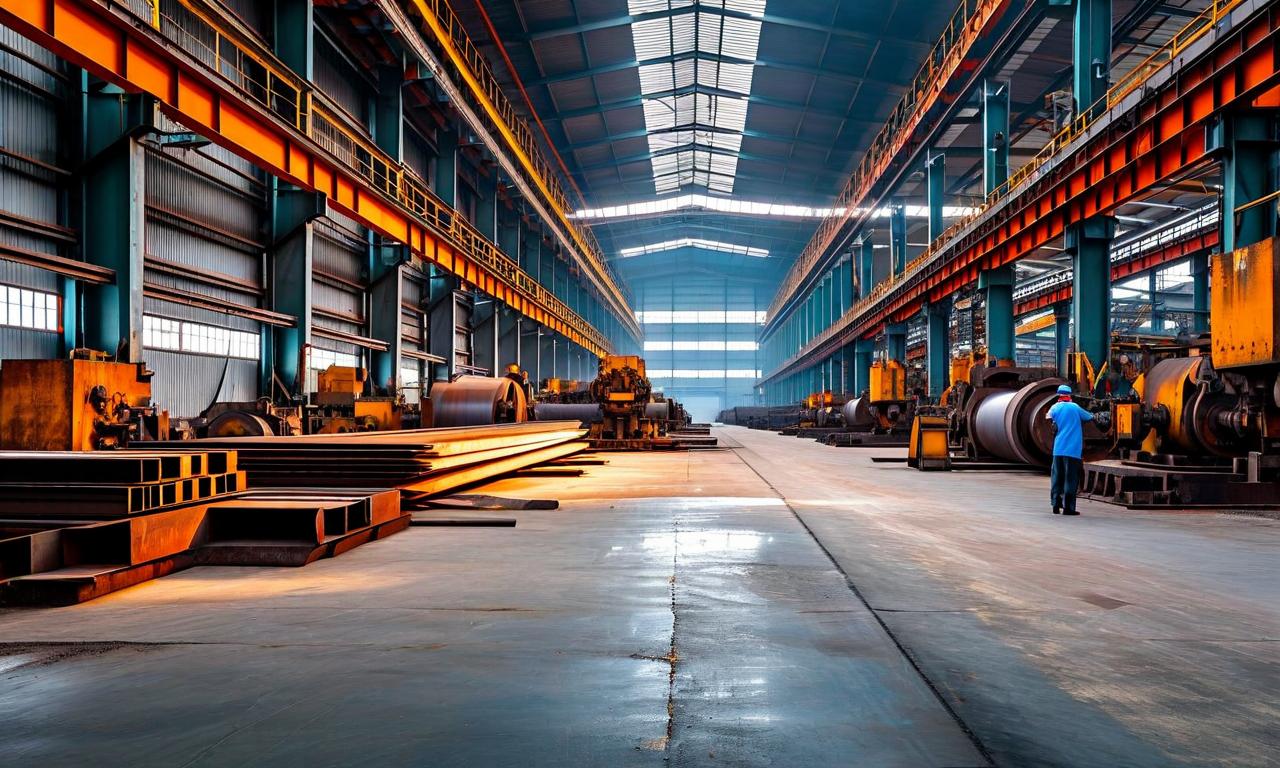
*this image is generated using AI for illustrative purposes only.
Kamdhenu Limited delivered exceptional profitability in Q3FY26, with net profit after tax surging 67% year-on-year to ₹20.8 crore despite a marginal revenue decline. The TMT bar manufacturer achieved record profit before tax margins of 15.9%, expanding by 620 basis points, driven by strong franchise performance and operational efficiency improvements.
Outstanding Q3FY26 Financial Performance
The company's quarterly results for the period ended December 31, 2025, demonstrated remarkable profit growth despite revenue headwinds. Key financial highlights include:
| Metric: | Q3FY26 | Q3FY25 | Change (%) |
|---|---|---|---|
| Revenue from Operations: | ₹168.8 crore | ₹175.0 crore | -3% |
| Profit Before Tax: | ₹26.8 crore | ₹16.9 crore | +58% |
| Net Profit After Tax: | ₹20.8 crore | ₹12.5 crore | +67% |
| PBT Margin: | 15.9% | 9.7% | +620 bps |
The significant improvement in profitability was achieved despite a 3% decline in revenue, primarily attributed to metal price fluctuations and implementation of GRAP Stage III and IV measures in the NCR region affecting own facility volumes.
Strong Nine-Month Performance Trajectory
For the nine months ended December 31, 2025, Kamdhenu Limited maintained robust growth momentum across key profitability metrics:
| Parameter: | 9M FY26 | 9M FY25 | Growth (%) |
|---|---|---|---|
| Revenue from Operations: | ₹555.8 crore | ₹549.7 crore | +1% |
| Profit Before Tax: | ₹81.2 crore | ₹57.9 crore | +40% |
| Net Profit After Tax: | ₹60.9 crore | ₹43.8 crore | +39% |
| PBT Margin: | 14.6% | 10.5% | +410 bps |
Franchise Business Drives Growth
The company's asset-light franchise model continued to deliver strong results, with franchise volumes growing 18% year-on-year to 9.7 lakh MT in Q3FY26. This growth translated into record royalty income performance:
| Business Segment: | Q3FY26 | Q3FY25 | Change (%) |
|---|---|---|---|
| Revenue from Own Facilities: | ₹125.6 crore | ₹141.4 crore | -11% |
| Volume from Own Facilities: | 28.1 thousand MT | 28.3 thousand MT | -1% |
| Revenue from Royalty Income: | ₹43.0 crore | ₹33.4 crore | +29% |
| Franchise Volumes: | 9.7 lakh MT | 8.3 lakh MT | +18% |
For the nine-month period, franchise volumes increased 11% to 27.7 lakh MT, while royalty income grew 28% to ₹128.9 crore, reflecting deeper brand penetration and improved partner throughput.
Management Commentary on Performance
Chairman & Managing Director Satish Kumar Agarwal highlighted the company's ability to deliver strong profitability despite TMT bar price volatility. He emphasized that royalty income remains a highly capital-efficient and RoCE accretive business, allowing scalability without incremental manufacturing investments. The management noted that own manufacturing facilities are operating at near peak utilization, making the asset-light franchise route the strategic priority for expansion.
Strategic Focus and Outlook
The company continues to evaluate investments in selective franchise partners to increase capacities where demand visibility is strong and regional presence can be strengthened. With expected revival in government and private capex and continued policy thrust on infrastructure, management remains confident of maintaining strong demand momentum in the TMT bar segment while delivering consistent, profitable growth.
Historical Stock Returns for Kamdhenu
| 1 Day | 5 Days | 1 Month | 6 Months | 1 Year | 5 Years |
|---|---|---|---|---|---|
| -1.84% | -4.11% | +2.68% | +40.51% | +5.43% | +89.52% |
 15
15