Graphite India Faces Challenges in Electrode Market Amid Rising Costs


Graphite India Limited, a major graphite electrode manufacturer, is experiencing intensified price competition and elevated raw material costs. Despite these challenges, the company reported a 13.4% year-on-year increase in net sales to ₹729.00 Cr for Q2 FY2026. However, EBITDA and net profit declined by 52.5% and 60.8% respectively. Capacity utilization improved to 99%, up from 84% in the previous year. The company maintains a strong balance sheet with a net cash position of ₹3,921.00 crore. While global crude steel production declined, India showed robust growth of 14.9%. The company remains optimistic about long-term industry dynamics, particularly due to the global focus on decarbonization and the adoption of electric arc furnace processes.
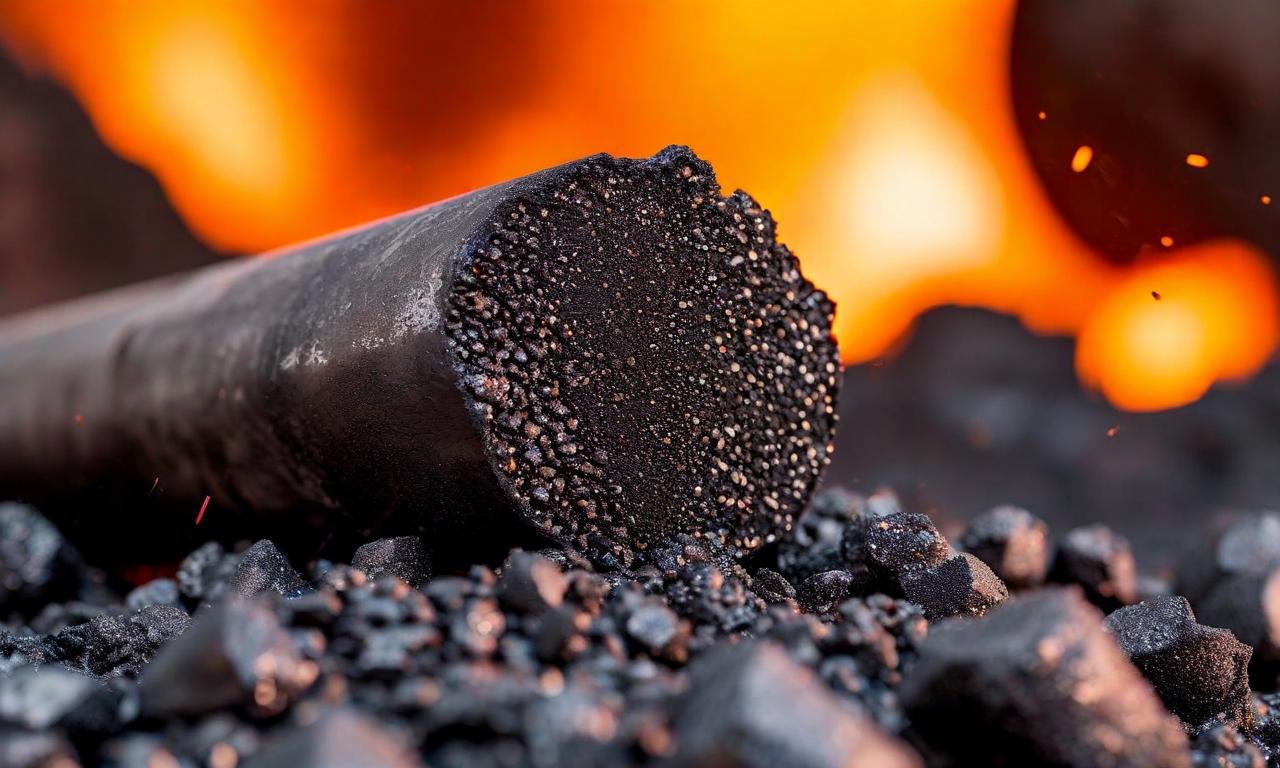

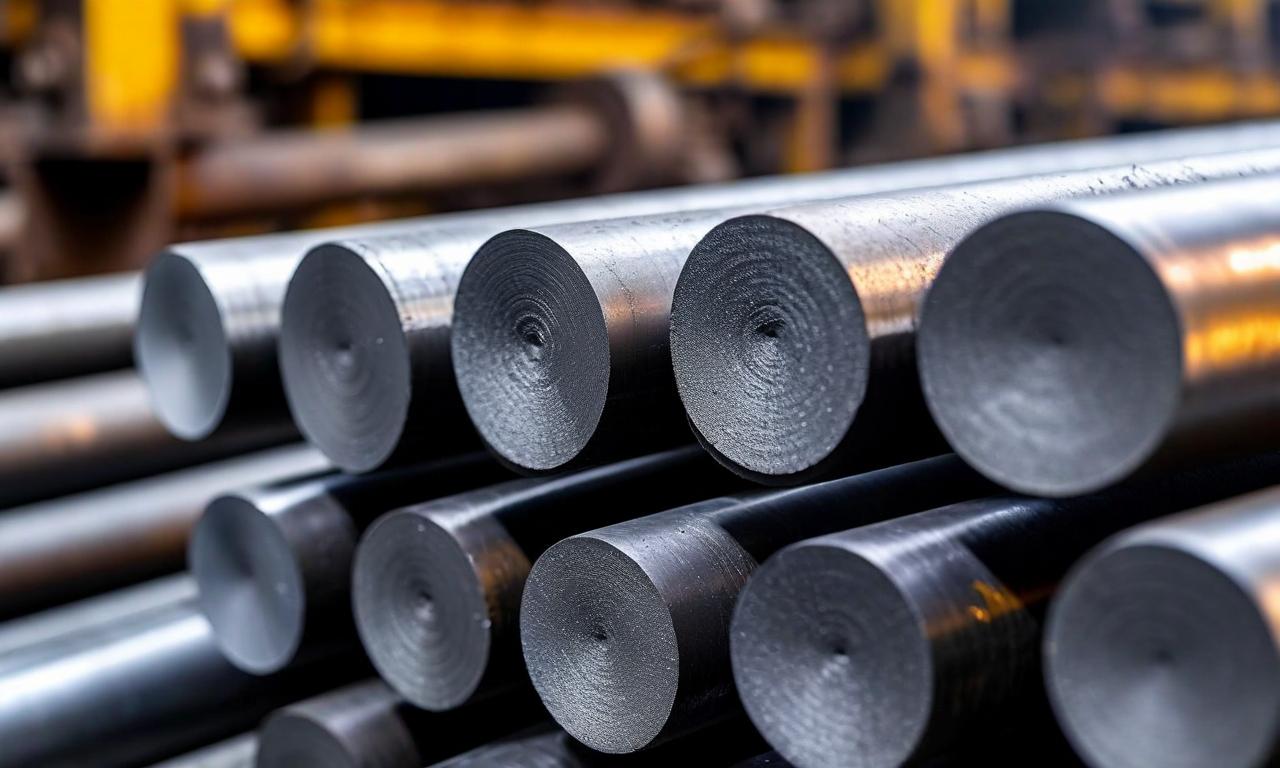
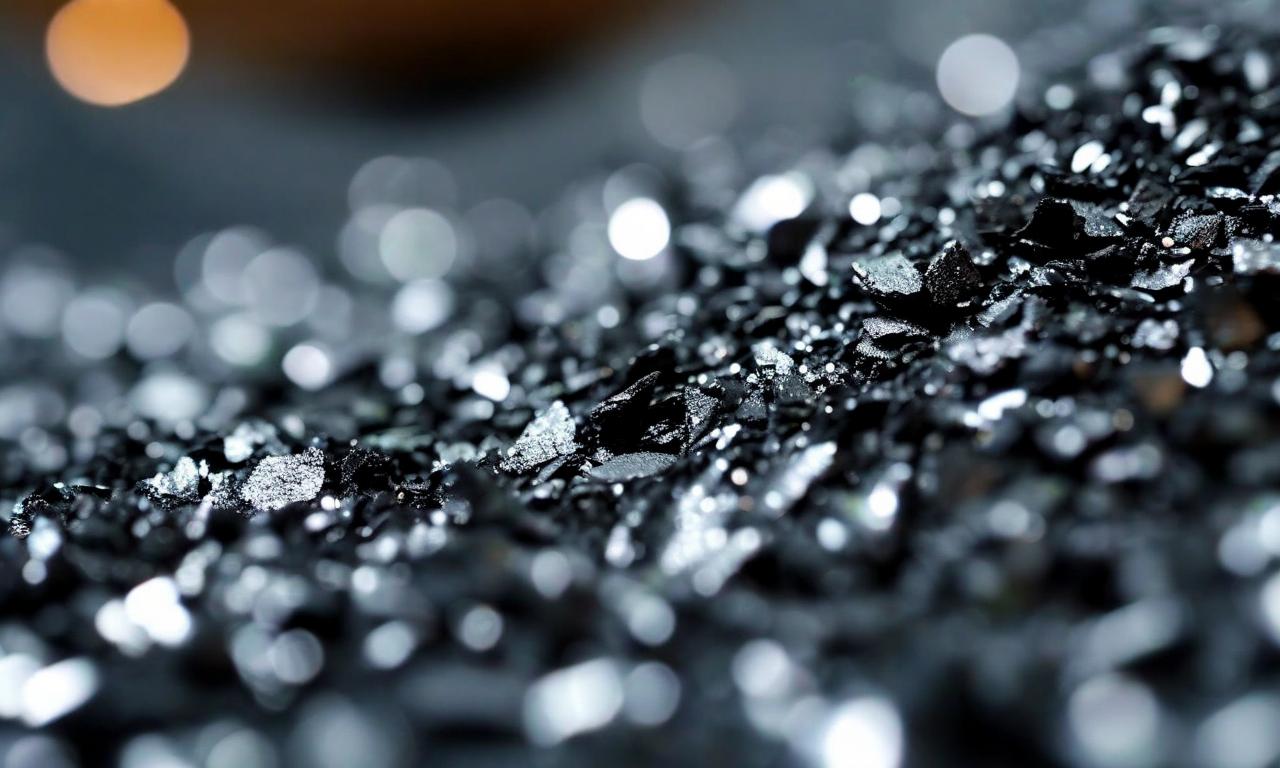
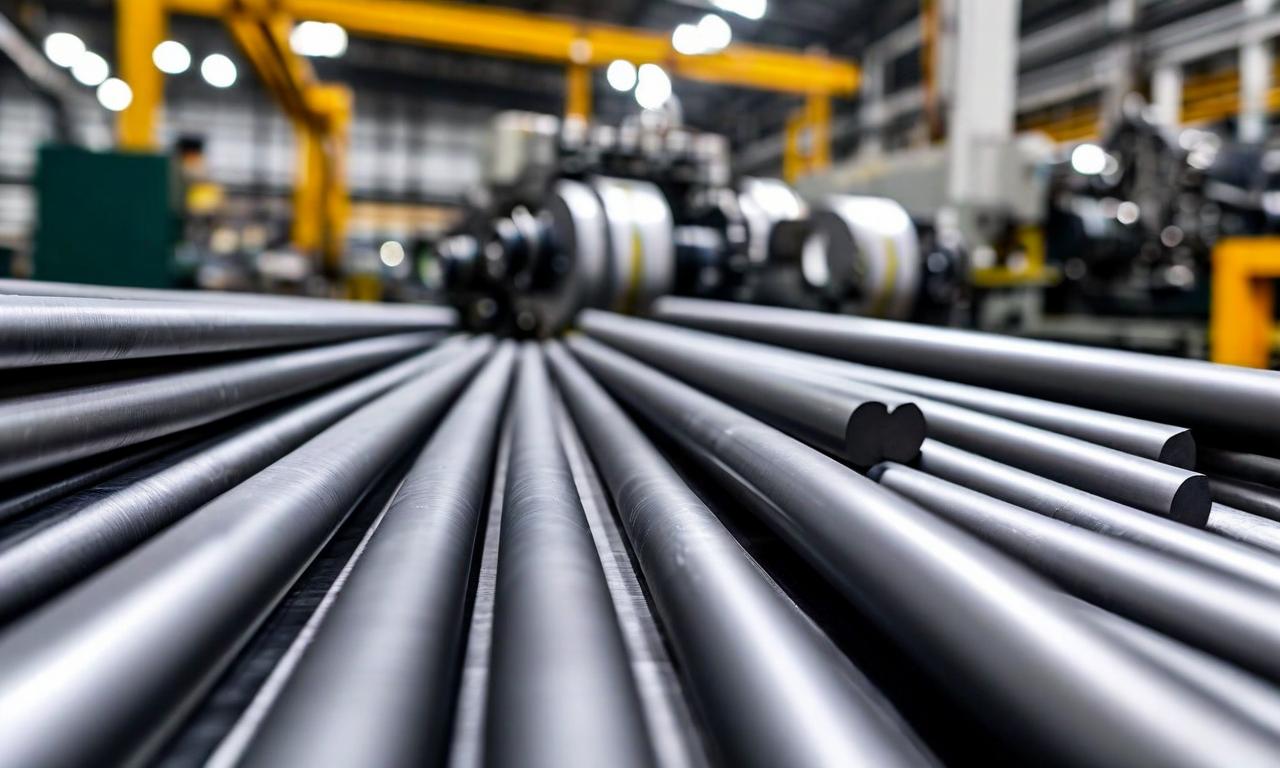
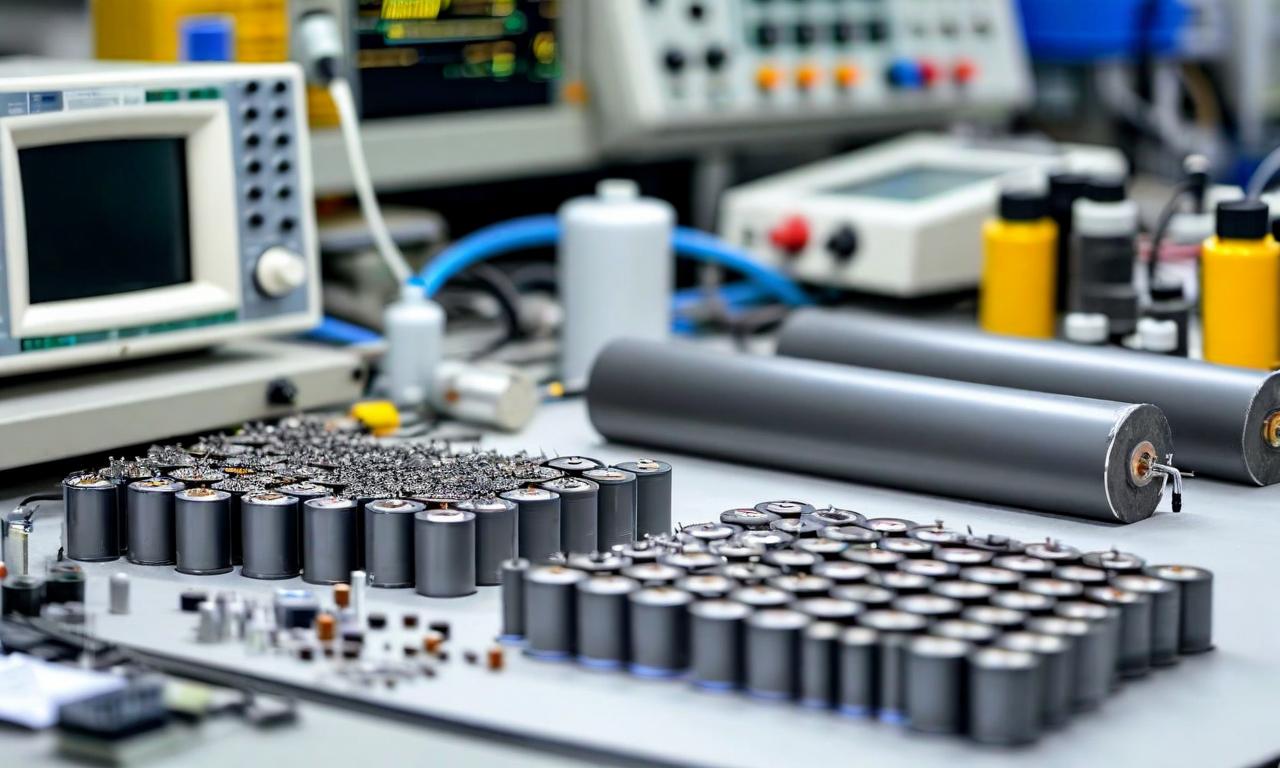
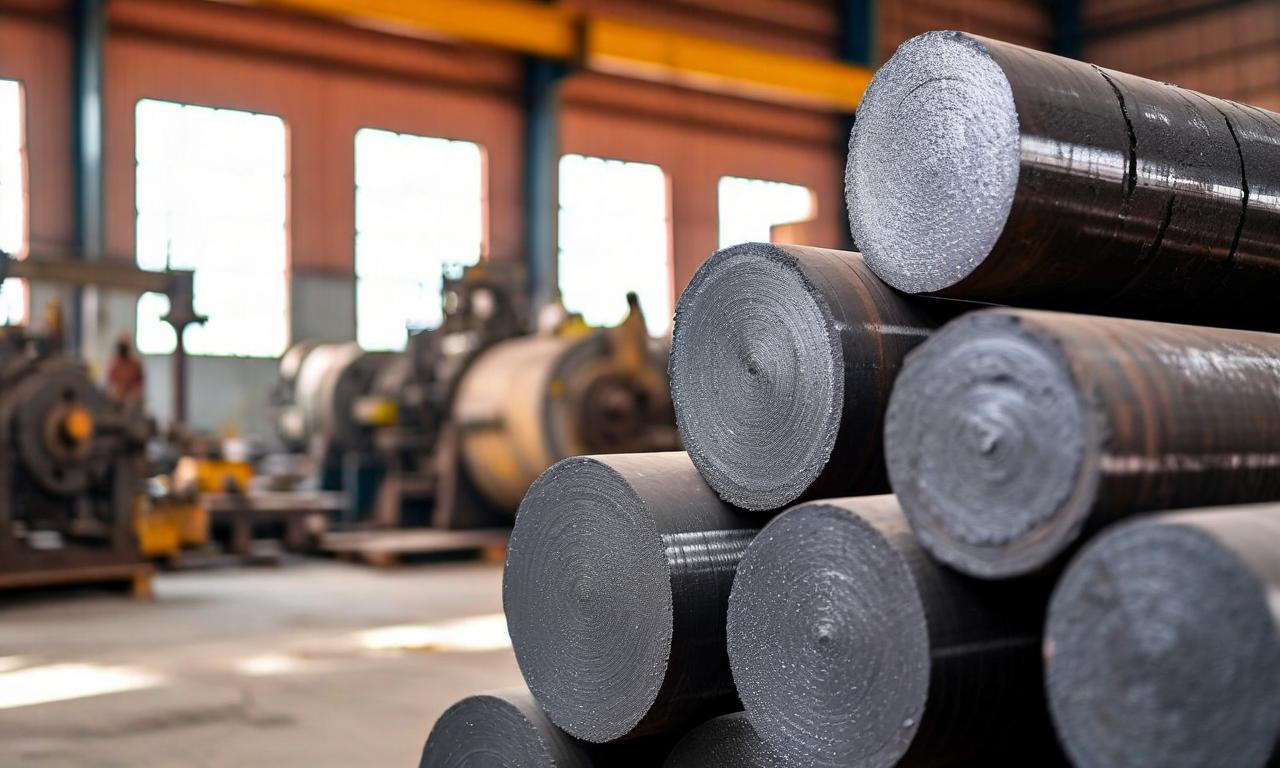
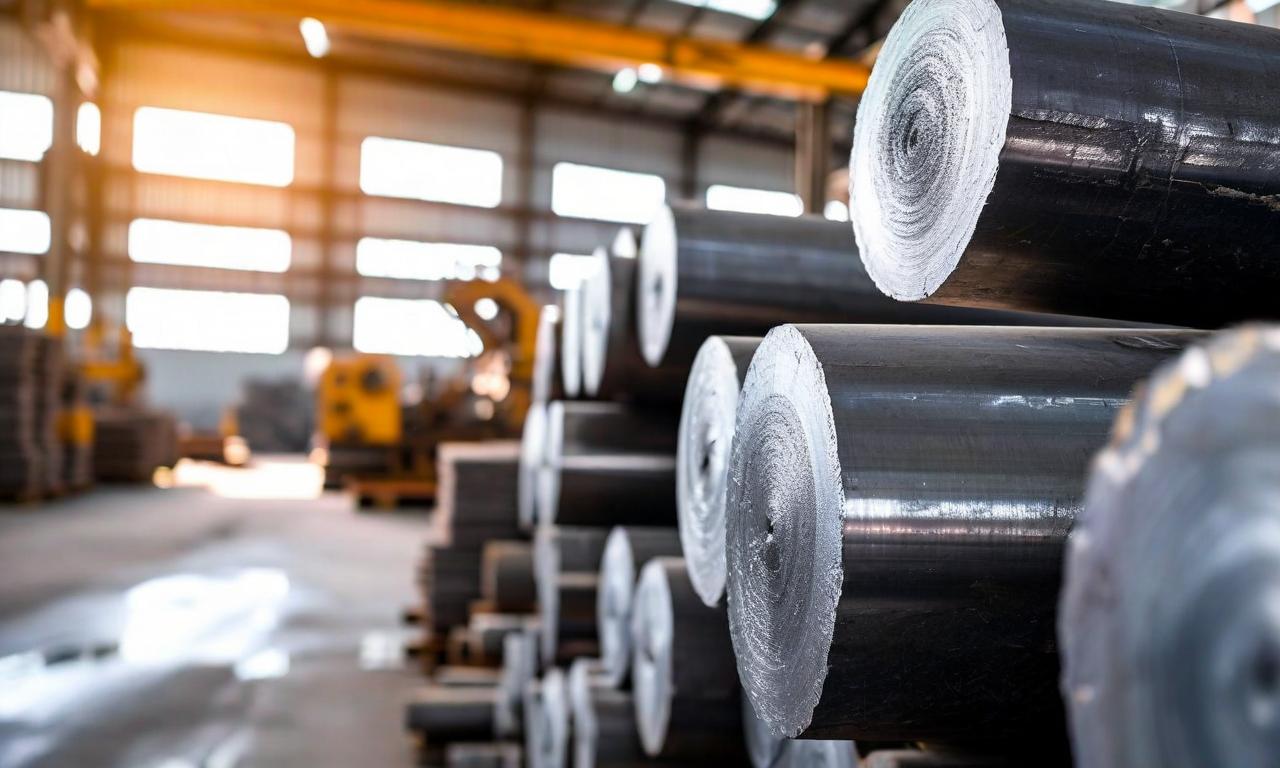
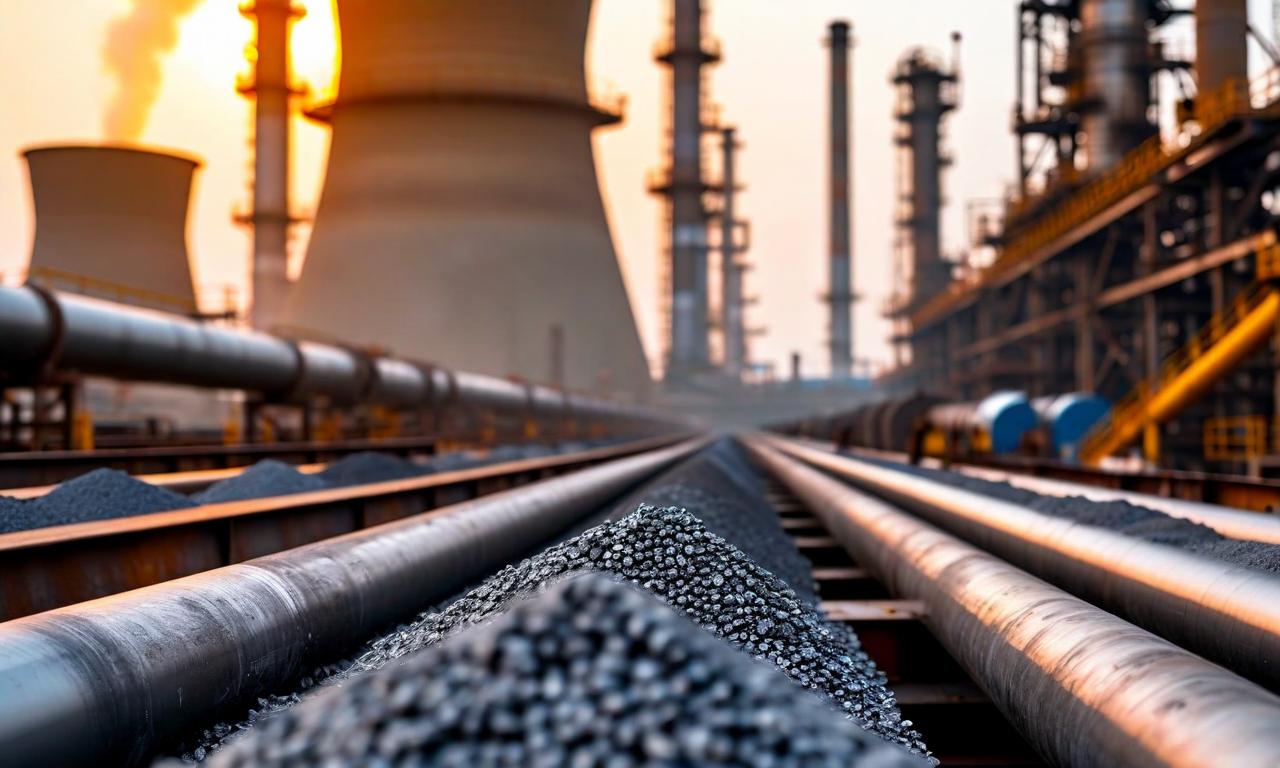
*this image is generated using AI for illustrative purposes only.
Graphite India Limited , a leading manufacturer of graphite electrodes, is grappling with intensifying price competition in the graphite electrode market while simultaneously dealing with elevated raw material costs, according to a recent statement from the company's Co-Chair.
Market Pressures
The graphite electrode industry, crucial for electric arc furnace (EAF) steel production, is experiencing significant market pressures. Graphite India, one of the largest producers globally with a manufacturing capacity of 98,000 tonnes per annum, is feeling the impact of these challenging market conditions.
Financial Performance
Despite the challenging environment, Graphite India has shown resilience in its financial performance for the quarter ended September 30:
| Financial Metric | Q2 FY2026 | Q2 FY2025 | YoY Change |
|---|---|---|---|
| Net Sales | ₹729.00 Cr | ₹643.00 Cr | +13.4% |
| EBITDA | ₹132.00 Cr | ₹278.00 Cr | -52.5% |
| Net Profit | ₹76.00 Cr | ₹194.00 Cr | -60.8% |
| EPS | ₹3.91 | ₹10.00 | -60.9% |
The company's net sales grew by 13.4% year-on-year, primarily driven by higher volumes at stable realizations. However, the impact of market pressures is evident in the significant decline in EBITDA and net profit.
Operational Highlights
- Capacity utilization increased to 99% in Q2 FY2026, up from 84% in Q2 FY2025.
- The company maintains a strong balance sheet with a net cash position of ₹3,921.00 crore as of September 30.
Industry Outlook
The graphite electrode industry faces both challenges and opportunities:
- Global crude steel production declined by 1.0% year-on-year to 437.1 million MT for the quarter ended September.
- Steel production in India showed robust growth, increasing by 14.9%, supported by ongoing infrastructure investments and manufacturing activity.
- The focus on decarbonization in developing economies is expected to support the growth of the Electric Arc Furnace (EAF) process, potentially driving future demand for graphite electrodes.
Management Commentary
K K Bangur, Chairman of Graphite India, stated, "Prices of graphite electrodes continued to face competitive headwinds while raw material costs, particularly petroleum needle coke, have not declined in tandem and consequently led to an impact on operating margins."
He added, "Graphite India is encouraged by the long-term dynamics of the graphite electrode industry, particularly with the global move towards decarbonization and the resulting adoption of the electric arc furnace process."
Conclusion
While Graphite India faces near-term challenges due to price competition and high raw material costs, the company remains optimistic about long-term industry dynamics. The management's focus on cost competitiveness and operational efficiencies, coupled with a strong financial position, may help the company navigate the current market pressures.
Investors and industry observers will be watching closely to see how Graphite India adapts to these market conditions and capitalizes on potential opportunities in the evolving steel production landscape.
Historical Stock Returns for Graphite
| 1 Day | 5 Days | 1 Month | 6 Months | 1 Year | 5 Years |
|---|---|---|---|---|---|
| -0.58% | +7.28% | -5.97% | -2.82% | +6.30% | -7.40% |
 17
17