NewsBlack Rose Industries Reports Q3 FY26 Revenue of ₹75.86 Crores, Down 10.02% Quarter-on-Quarter
Black Rose Industries Reports Q3 FY26 Revenue of ₹75.86 Crores, Down 10.02% Quarter-on-Quarter


Black Rose Industries Limited reported Q3 FY26 revenue of ₹75.86 crores, down 10.02% from Q2 FY26, while maintaining profitability with PAT of ₹4.41 crores. Despite revenue moderation, the company showed improved operating performance with better margins across both manufacturing and distribution businesses. The company successfully addressed temporary plant closure issues and expects stronger performance in upcoming quarters driven by export growth and new product development initiatives.
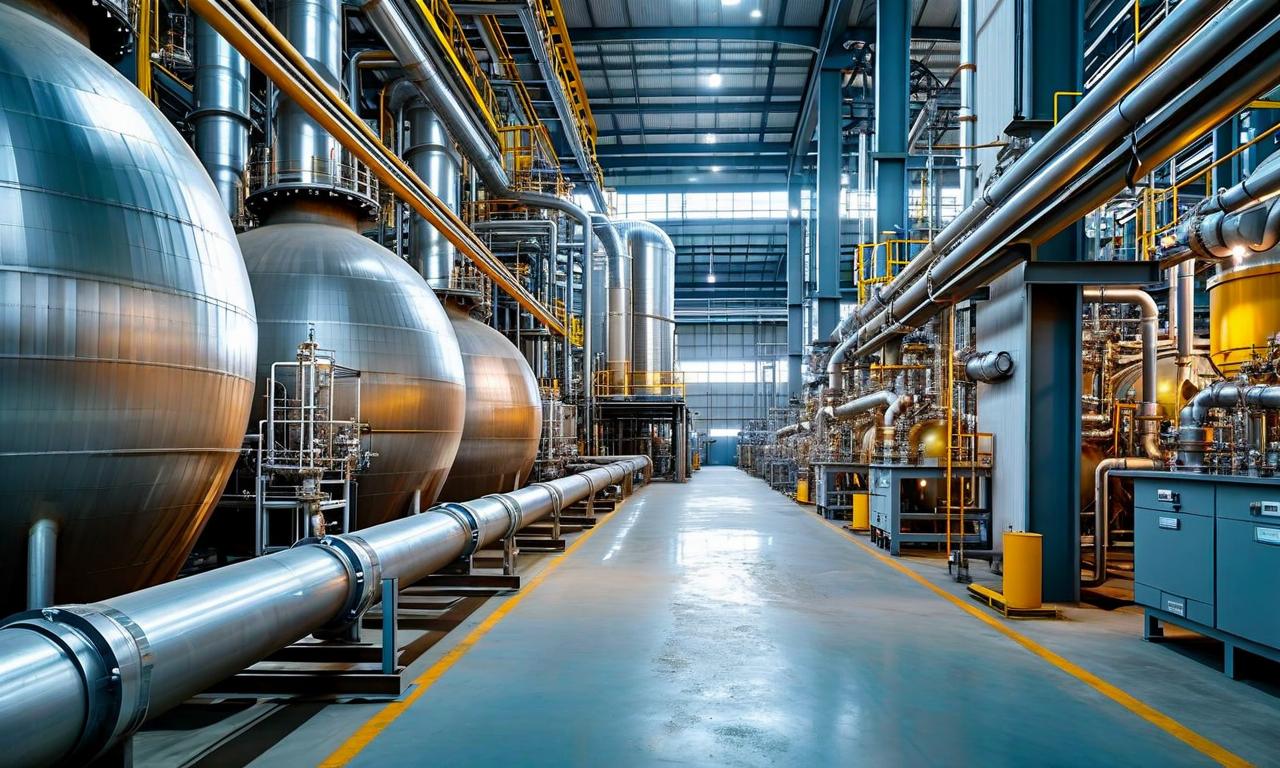

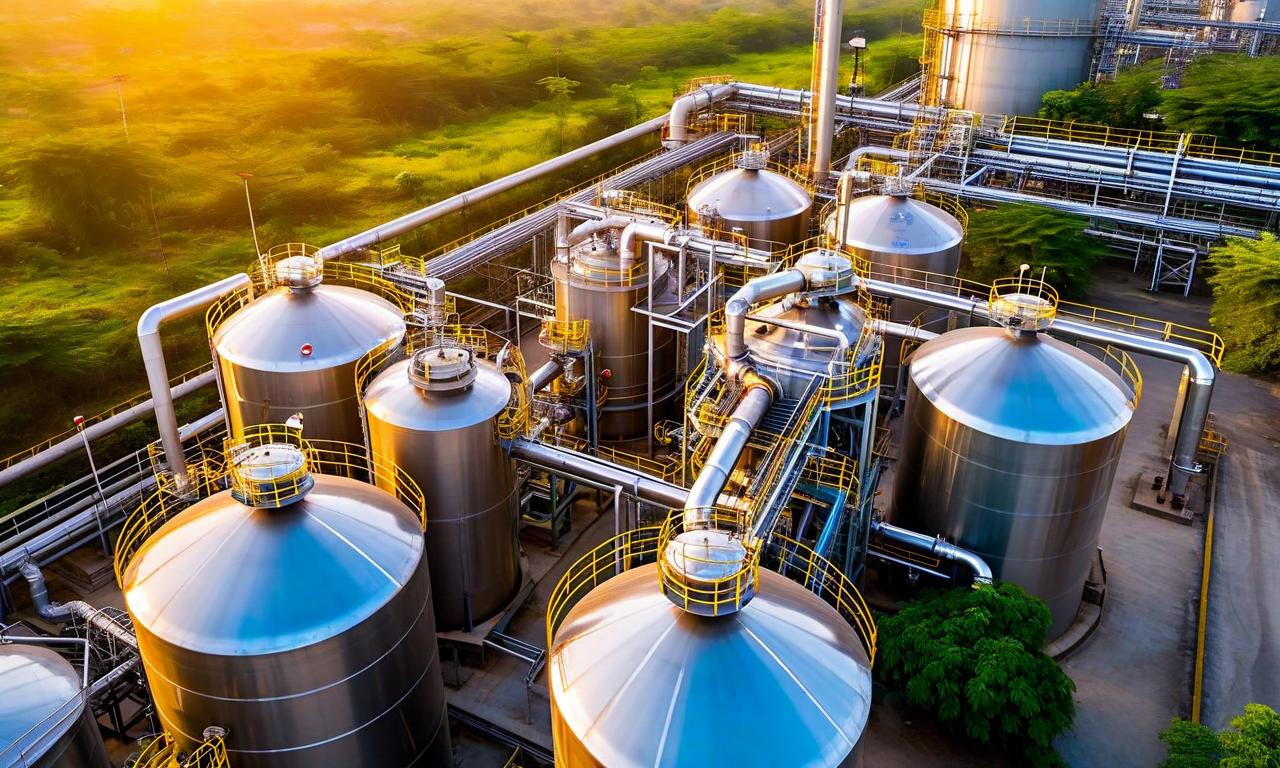
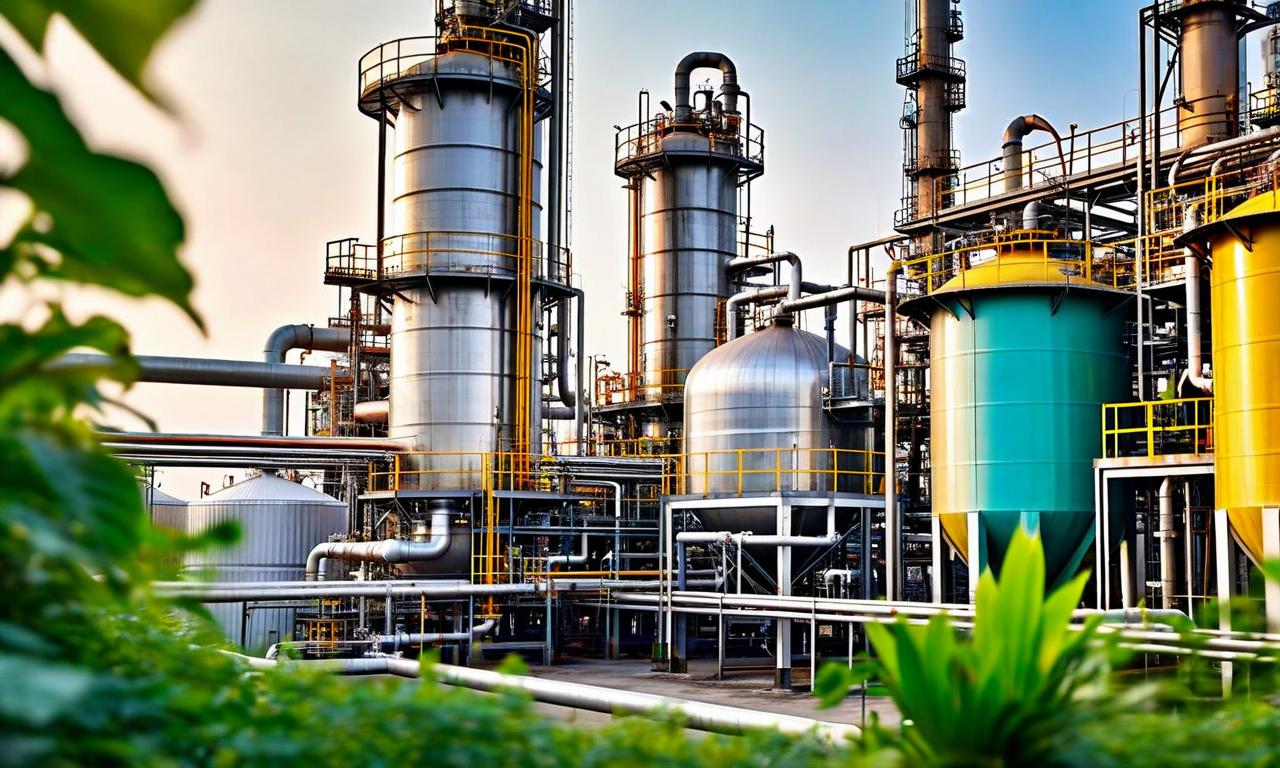
*this image is generated using AI for illustrative purposes only.
Black Rose Industries Limited reported its Q3 FY26 performance results, showing revenue of ₹75.86 crores compared to ₹84.31 crores in Q2 FY26. While revenue moderated during the quarter, the company delivered stronger operating performance with improved profitability across both manufacturing and distribution businesses, supported by enhanced product mix and higher export contribution.
Financial Performance Overview
The company's financial metrics for Q3 FY26 showed mixed results compared to the previous quarter:
| Metric | Q3 FY26 (₹ Cr) | Q2 FY26 (₹ Cr) | Change (%) |
|---|---|---|---|
| Revenue | 75.86 | 84.31 | -10.02% |
| EBITDA | 7.23 | 7.54 | -4.11% |
| PBT | 5.94 | 6.09 | -2.46% |
| PAT | 4.41 | 4.43 | -0.45% |
Despite the revenue decline, the company maintained relatively stable profitability, with PAT declining only marginally by 0.45%. The EBITDA margin improved to 9.63% in Q3 FY26 from 8.98% in Q2 FY26, while net profit margin increased to 5.87% from 5.28%.
Segment-wise Performance Analysis
The standalone segment-wise results revealed varying performance across business divisions:
| Segment | Q3 FY26 Sales (₹ Cr) | Q3 FY26 EBITDA (₹ Cr) | Q2 FY26 Sales (₹ Cr) | Q2 FY26 EBITDA (₹ Cr) |
|---|---|---|---|---|
| Distribution | 49.02 | 3.19 | 52.56 | 3.08 |
| Manufacturing | 26.32 | 5.95 | 31.32 | 6.01 |
| Unallocated | 0.52 | -1.91 | 0.43 | -1.55 |
The distribution division maintained better EBITDA performance despite lower sales, while the manufacturing division experienced both revenue and EBITDA decline. The distribution to manufacturing revenue ratio increased to 1.86:1 from 1.68:1 in the previous quarter.
Key Financial Indicators
Several financial ratios demonstrated the company's operational stability:
| Parameter | Q3 FY26 | Q2 FY26 | Q1 FY26 |
|---|---|---|---|
| Debt : Equity Ratio | 0.103 | 0.043 | 0.006 |
| Interest Coverage Ratio | 20.34 | 12.95 | 29.20 |
| Current Ratio | 3.85 | 3.09 | 4.52 |
| Quick Ratio | 1.92 | 1.51 | 2.07 |
| Return on Equity | 11.00% | 11.40% | 11.00% |
Operational Developments
The company faced temporary operational challenges when the Gujarat Pollution Control Board issued closure directions for its Jhagadia plant on December 05, 2025. However, the order was revoked on December 26, 2025, enabling immediate resumption of operations. The brief shutdown had no material impact on financial performance due to sufficient inventory levels.
In the manufacturing division, acrylamide liquid segment delivered healthy operating performance supported by stronger export volumes, while solid acrylamide sales were lower due to competitive market conditions. N-methylol acrylamide showed growth with increased sales volumes and new customer onboarding.
Future Outlook and Projects
The company expects stronger performance in upcoming quarters, with the manufacturing division projected to deliver improved results through higher acrylamide liquid sales across export and domestic markets. The distribution business anticipates stronger performance supported by stable domestic demand and increased merchant export volumes.
During Q3 FY26, the polyacrylamide solid development program progressed toward the piloting phase, while the specialty amines project with Koei Chemicals advanced as planned. The R&D team initiated new product development initiatives aimed at creating fresh manufacturing opportunities in coming quarters.
Historical Stock Returns for Black Rose Industries
| 1 Day | 5 Days | 1 Month | 6 Months | 1 Year | 5 Years |
|---|---|---|---|---|---|
| -1.86% | -8.11% | -14.11% | +15.70% | +15.70% | +15.70% |
 15
15