Awfis Space Solutions Reports Strong Q3FY26 Results with 20% Revenue Growth


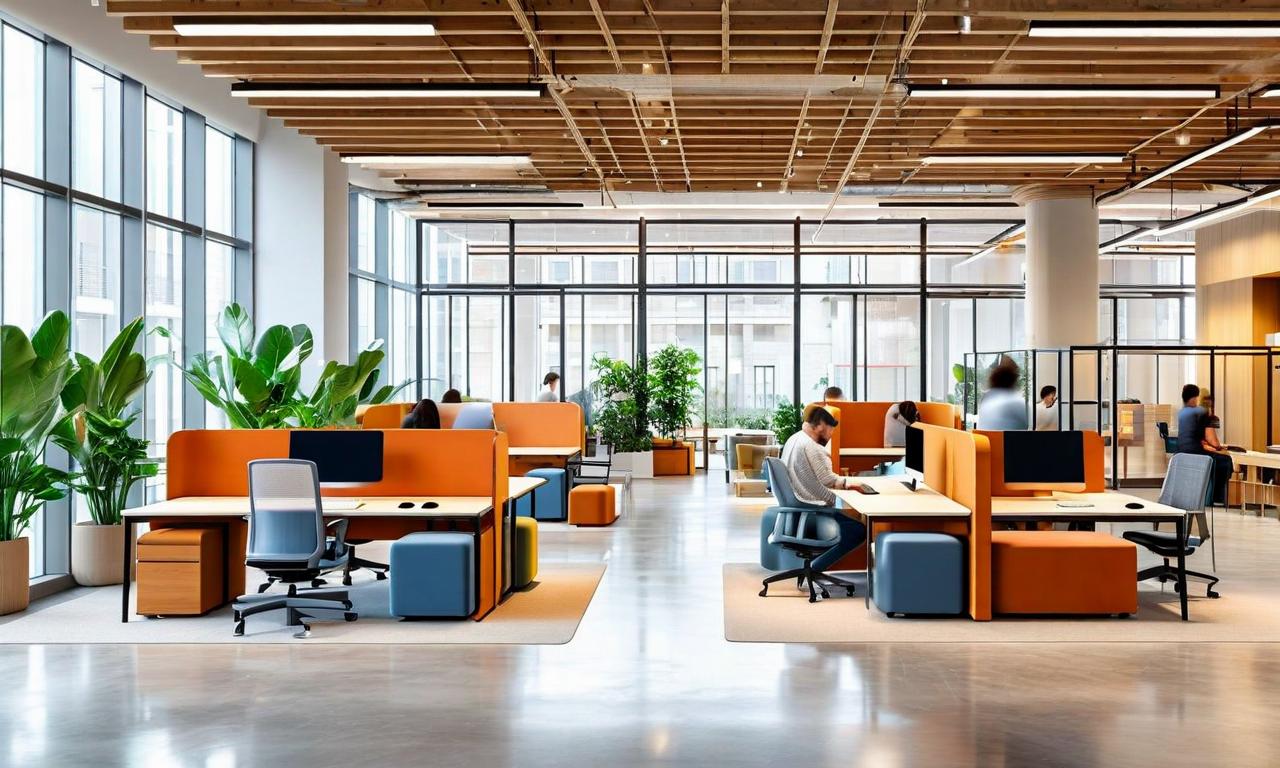
Awfis Space Solutions delivered robust Q3FY26 performance with operating revenue growing 20% to ₹382 crores and EBITDA expanding 30% to ₹139 crores with improved margins of 36.5%. The company's network expansion to 257 centres across 18 cities, strong GCC client base growth, and capital-efficient Managed Aggregation model demonstrate sustained operational excellence and market leadership in flexible workspace solutions.

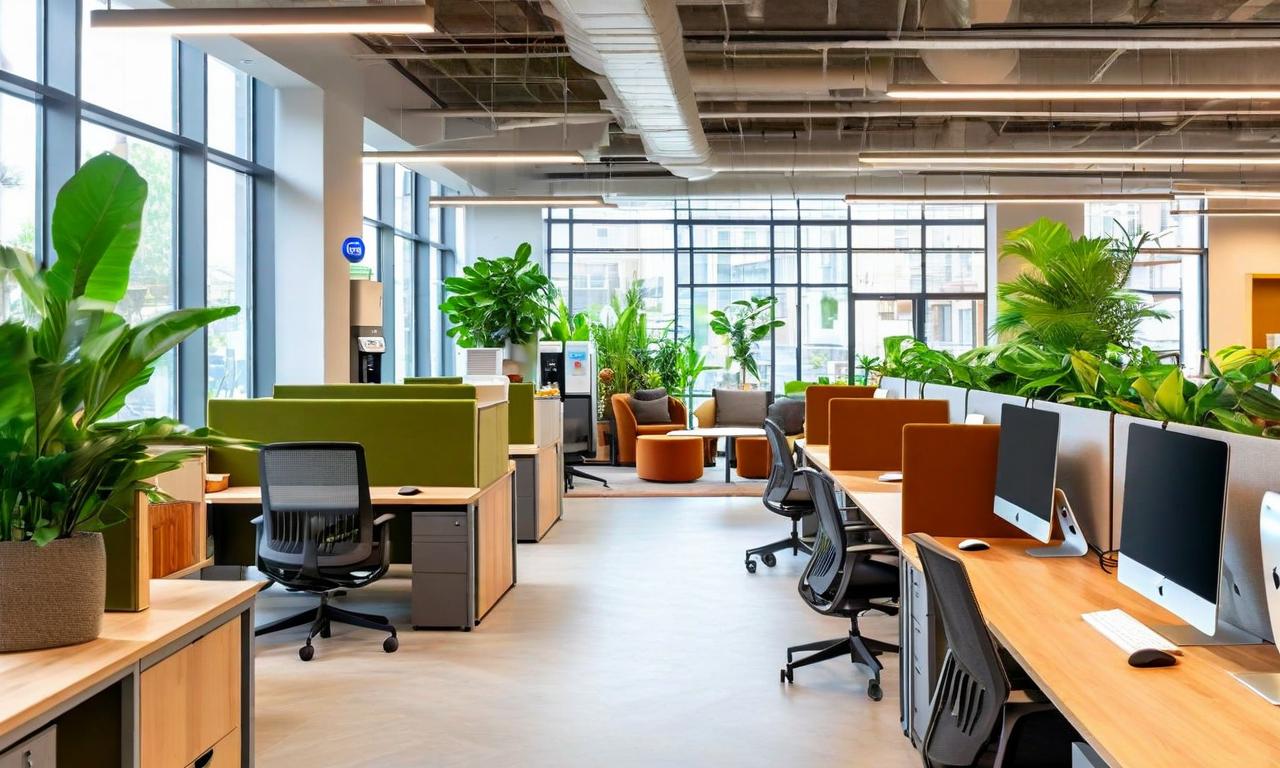
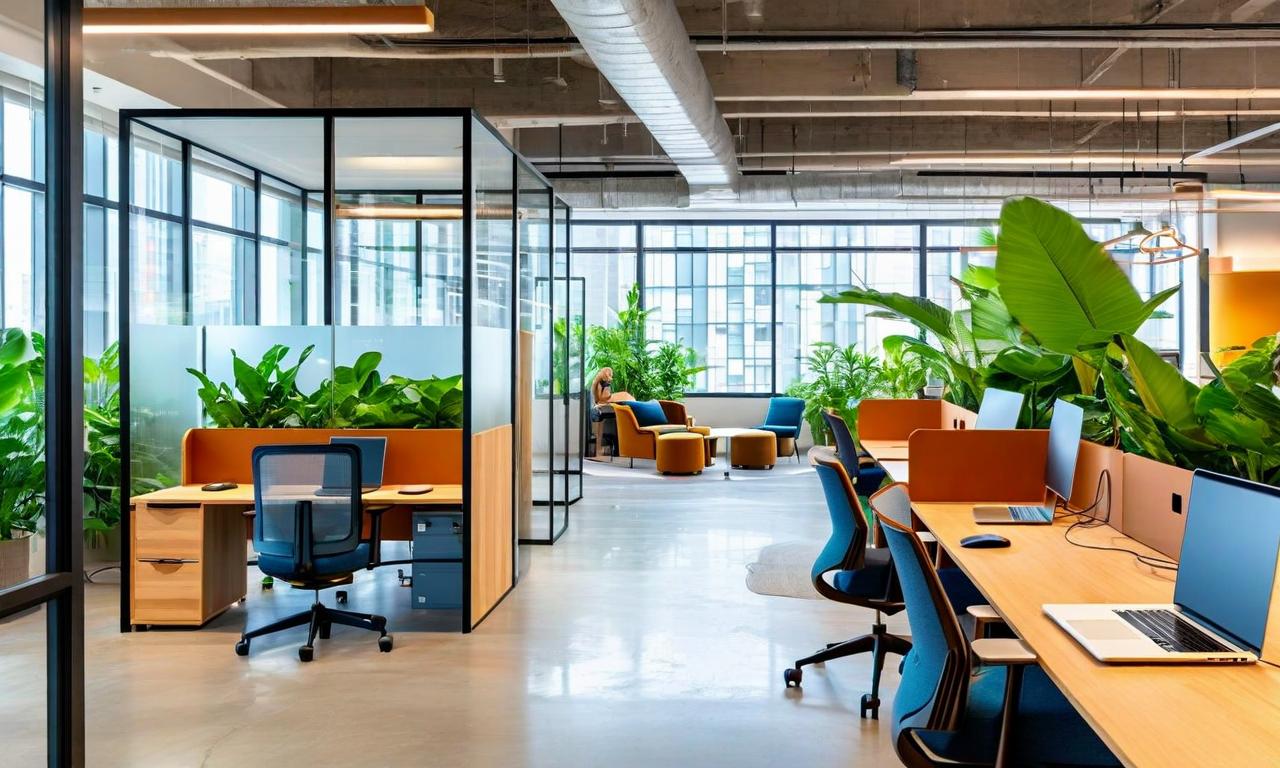
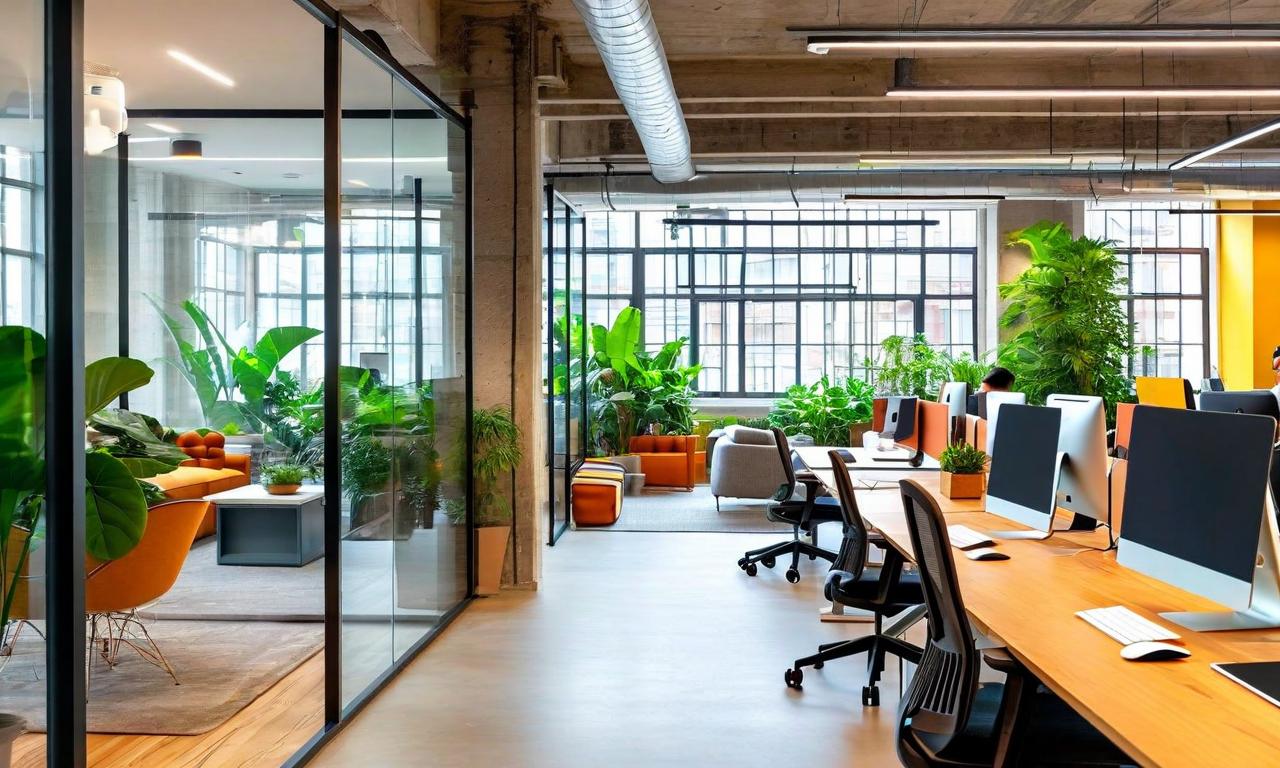
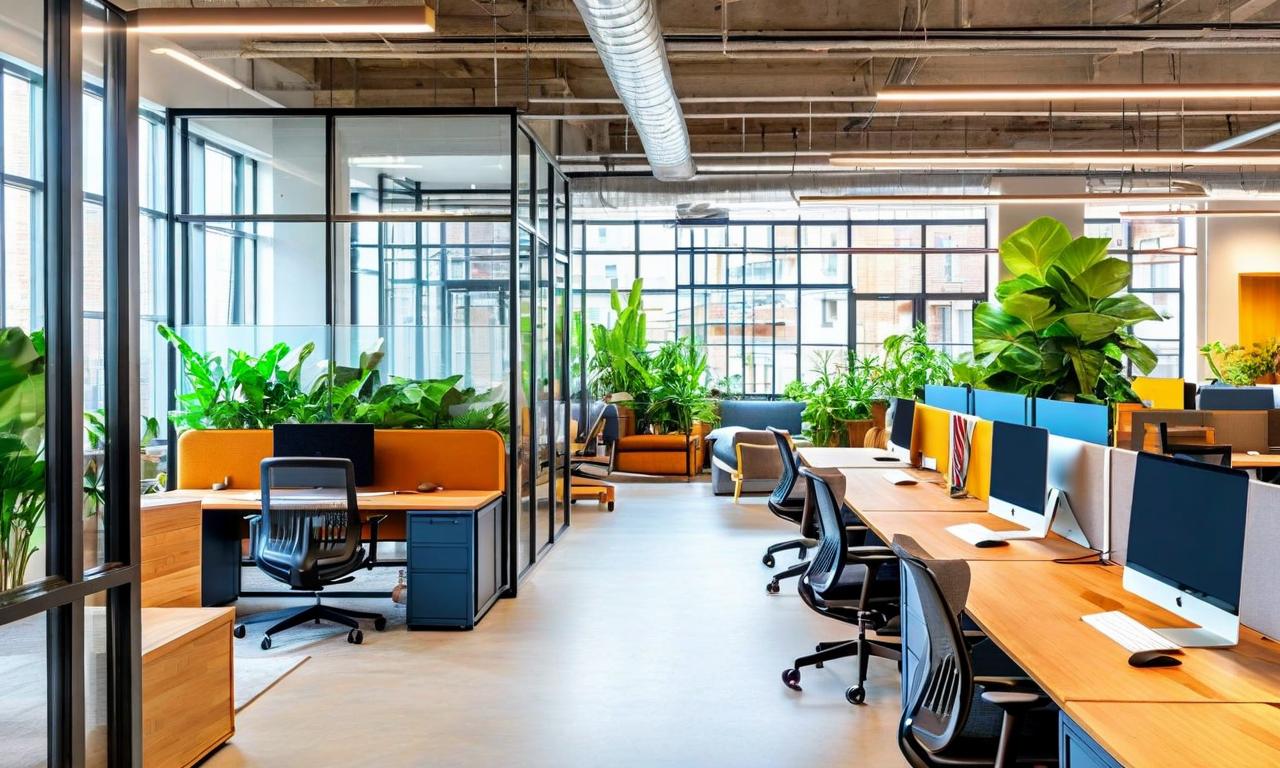
*this image is generated using AI for illustrative purposes only.
Awfis Space Solutions announced its unaudited financial results for Q3FY26 through a regulatory filing dated February 02, 2026. The Board of Directors approved the quarterly results for the quarter and nine months ended December 31, 2025, demonstrating robust operational performance across key business segments.
Financial Performance Highlights
The company reported strong operating revenue of ₹382 crores for Q3FY26, representing a growth of 20% year-on-year. Operating EBITDA grew by 30% to ₹139 crores, with EBITDA margins expanding by 270 basis points to 36.5%, reflecting improved scale efficiencies and operating leverage. Profit after tax (excluding exceptional items) stood at ₹22 crores, marking a growth of 52% year-on-year.
| Financial Metrics: | Q3FY26 | Growth (YoY) |
|---|---|---|
| Operating Revenue: | ₹382 crores | +20% |
| Operating EBITDA: | ₹139 crores | +30% |
| EBITDA Margin: | 36.5% | +270 bps |
| PAT (ex-exceptional): | ₹22 crores | +52% |
Segment-wise Performance Analysis
The co-working and allied services segment demonstrated robust growth of 32% year-on-year, driving the overall revenue performance. This growth was supported by sustained demand across enterprise and GCC clients, along with disciplined execution of the company's capital-efficient expansion strategy.
Nine-Month Performance Overview
For the nine months ended December 31, 2025, the company reported operating revenue of ₹1,083 crores, representing a growth of 25% year-on-year. Operating EBITDA for the nine-month period grew by 39% to ₹398 crores, with margins expanding by 373 basis points to 36.7%. Profit after tax (excluding exceptional items) stood at ₹48 crores, reflecting growth of 50% year-on-year.
| Nine-Month Metrics: | 9MFY26 | Growth (YoY) |
|---|---|---|
| Operating Revenue: | ₹1,083 crores | +25% |
| Operating EBITDA: | ₹398 crores | +39% |
| EBITDA Margin: | 36.7% | +373 bps |
| PAT (ex-exceptional): | ₹48 crores | +50% |
Operational Expansion and Network Growth
During Q3FY26, the company added 10 new centres and 8,000 seats, expanding its network to 257 centres with approximately 177,000 seats across 18 cities. For the nine-month period, the company added 22,000 seats, contributing to a year-over-year growth of 34,000 seats. All new supply additions were in Grade A/A- assets, with 7 new additions to the Gold/Elite portfolio.
| Operational Metrics: | As of Dec 31, 2025 |
|---|---|
| Total Centres: | 257 |
| Total Seats: | 177,000 |
| Cities Covered: | 18 |
| Premium Centres: | 32 (25 Gold, 7 Elite) |
| Client Base: | 3,400+ customers |
Strategic Business Developments
The company maintains strong growth visibility through its Managed Aggregation model, with around 62% of signed supply under this capital-efficient approach. Multi-centre clients now account for around 46% of the client base, reflecting deeper relationships and growing pan-India mandates. The GCC portfolio continues expanding with 80+ unique GCC clients representing 21% of rental revenue share.
Management Commentary
Mr. Amit Ramani, Chairman and Managing Director, highlighted the strong operational and financial performance driven by sustained enterprise demand and disciplined execution. He noted the company's annualized ROCE at 66% and ROE at 17%, demonstrating superior capital efficiency. The management emphasized favourable industry tailwinds and the company's positioning to capture demand across client cohorts.
Historical Stock Returns for Awfis Space Solutions
| 1 Day | 5 Days | 1 Month | 6 Months | 1 Year | 5 Years |
|---|---|---|---|---|---|
| -2.14% | -2.19% | -5.71% | -29.16% | -55.96% | -32.64% |
 20
20