

ZJK Industrial H1FY26 Results: Sales up 36.6%, EPS falls 20% to $0.08


- Revenue rose 36.6% YoY to $33.74 million, driven by a 35.29% increase in average selling prices
- Net income fell to $5.24 million from $5.84 million as operating expenses jumped 33% to $8.64 million
- Gross profit margin contracted to 42.35% from 49.87% due to rising material and labor costs
- EPS declined 20% to $0.08, though operating cash flow grew 28.75% to $3.19 million
- Company secured large-volume AI infrastructure orders post-H1, signaling future growth potential

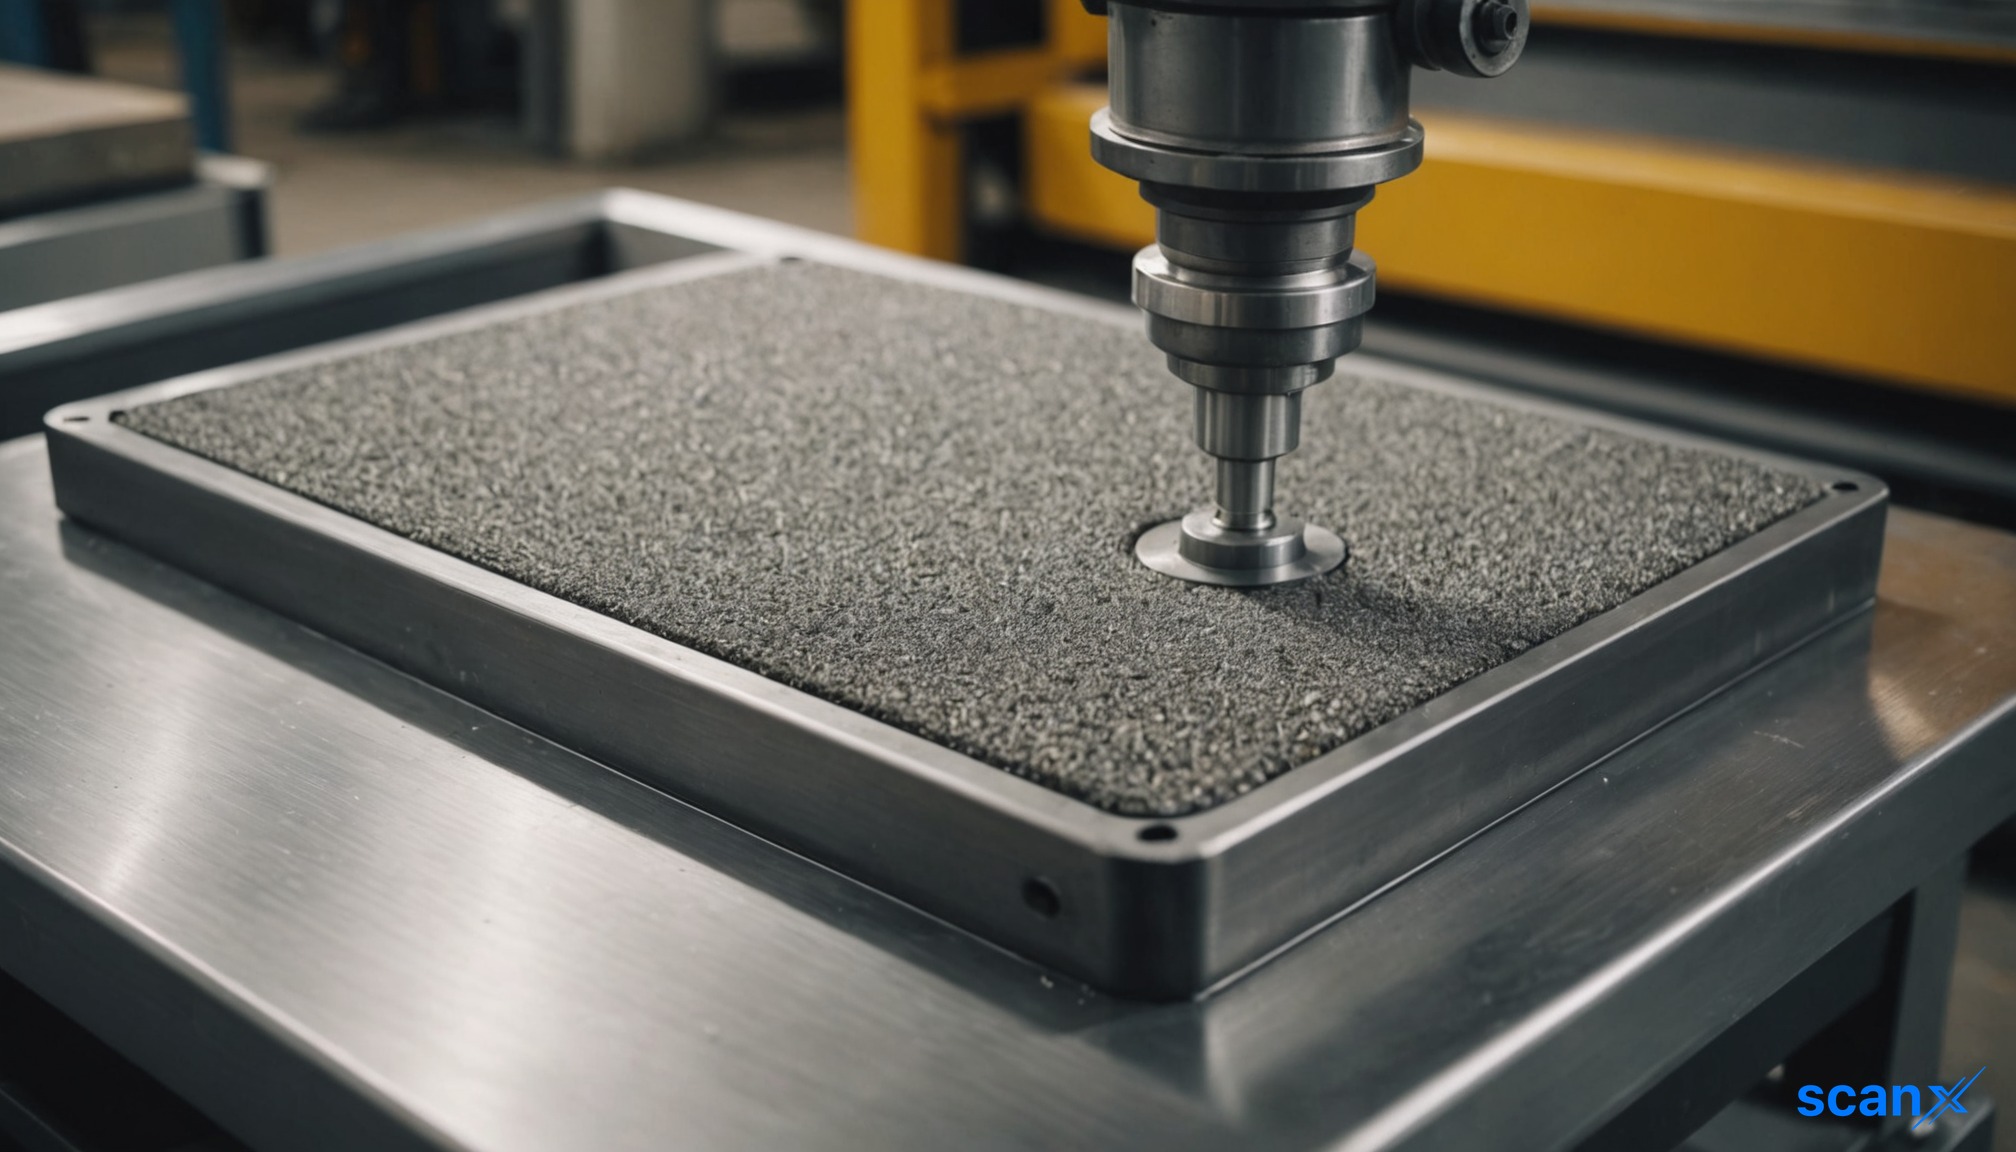

*this image is generated using AI for illustrative purposes only.
ZJK Industrial (NASDAQ: ZJK) reported a significant divergence in its first-half financial performance for FY26, with sales rising sharply while earnings per share declined. The company logged $33.745 million in revenue, a substantial increase from the prior year period, driven primarily by a 35.29 percent rise in average selling prices.
Despite the top-line growth, profitability metrics contracted. Earnings per share fell to $0.08, down from $0.10 in the same period last year. This represents a 20 percent decrease in EPS, indicating that cost structures and operational efficiencies did not keep pace with the revenue expansion. Net income dropped to $5.24 million from $5.84 million in H1FY25.
Financial Performance Overview
The company’s revenue growth was driven by a 36.60 percent increase in sales compared to the previous year. Total sales reached $33.745 million, up from $24.703 million in the corresponding prior-year period. However, gross profit margin compressed to 42.35 percent from 49.87 percent, as increased material procurement prices and labor costs outweighed the benefit of higher unit prices.
| Metric | Current Period (H1FY26) | Prior Year Period (H1FY25) | Change |
|---|---|---|---|
| Revenue | $33.745 million | $24.703 million | +36.60% |
| Gross Profit | $14.29 million | $12.32 million | +16.01% |
| Net Income | $5.24 million | $5.84 million | -10.27% |
| Earnings Per Share | $0.08 | $0.10 | -20% |
Operating expenses rose significantly to $8.64 million from $6.46 million, largely due to a 52.86 percent jump in general and administrative expenses, which included a $0.63 million increase in share-based compensation. Selling and marketing expenses also grew 19.33 percent to $4.24 million, reflecting expanded overseas shipping demands and headcount increases to support global expansion into North America, Singapore, and Taiwan.
Strategic Outlook and AI Infrastructure
Management highlighted that AI infrastructure and liquid cooling are becoming increasingly important growth drivers. Subsequent to the first half of 2026, ZJK secured large-volume purchase orders for AI infrastructure components from several major customers and has commenced deliveries. The company anticipates strong growth momentum will continue through the second half of 2026, supported by these ongoing deliveries and continued demand from advanced technology applications.
What the Numbers Show
The data reveals a clear margin compression dynamic alongside strategic investment. While revenue expanded by nearly 37 percent, gross profit grew at a slower rate of 16 percent, and net income declined. This divergence suggests that the additional revenue generated was not fully converted into bottom-line profit due to higher input costs and increased operating leverage. Notably, other income decreased by $0.54 million to $1.37 million, primarily due to lower foreign exchange gains, further pressuring the bottom line despite stable income from operations of $5.66 million.
Cash flow from operating activities improved by 28.75 percent to $3.19 million, indicating stronger cash conversion despite the profit dip. Total cash and short-term investments stood at $23.16 million as of June 30, 2026, an increase of 24.37 percent from year-end 2025, providing a solid liquidity buffer for its ongoing capacity expansions and R&D investments.

How will ZJK Industrial manage the ongoing compression of gross profit margins as material and labor costs continue to rise against its 35% increase in average selling prices?
What specific operational efficiencies or cost-control measures does management plan to implement to reverse the 20% decline in earnings per share in the second half of FY26?
To what extent will the newly secured large-volume AI infrastructure and liquid cooling orders contribute to revenue growth and margin recovery in H2FY26?
 18
18




 Create Custom Screeners
  Access 200+ Pre-built Filters
  Use 50+ Readymade Screener





