

Watts Water Technologies Reports Record Q2 2026 Results; Raises Full Year Outlook


Watts Water Technologies delivered record second quarter 2026 results with net sales of $763.2 million, up 19% on a reported basis and 12% organically, driven by data center growth and favorable pricing. Adjusted diluted EPS rose 18% to $3.66, while diluted EPS increased 17% to $3.53. The company raised its full year 2026 sales growth outlook to 14%–17% on a reported basis and 8%–11% organically, with adjusted operating margin guidance of 19.8%–20.4%.



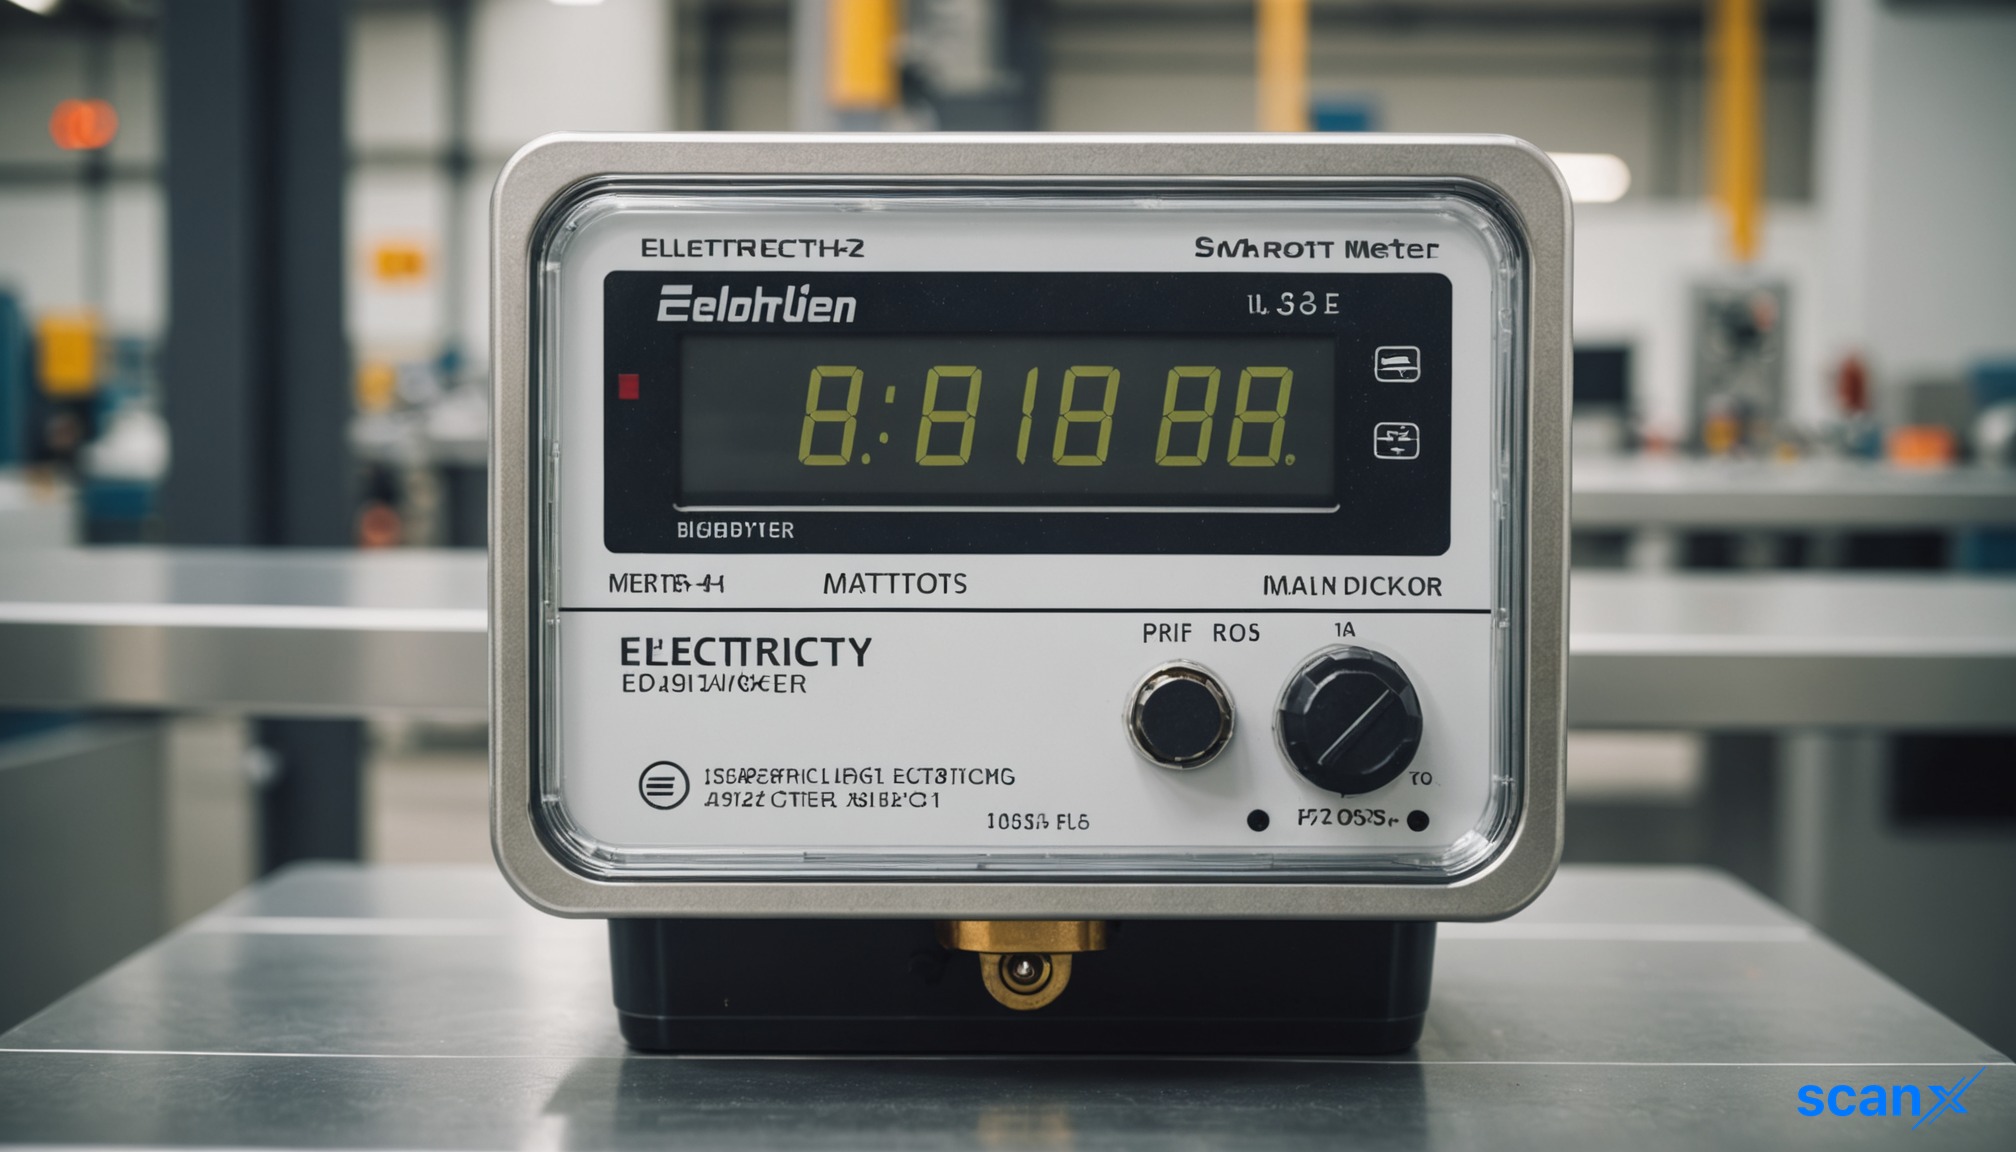
*this image is generated using AI for illustrative purposes only.
Watts Water Technologies, Inc., one of the world's leading manufacturers and providers of plumbing, heating, and water quality products and solutions, reported record second quarter 2026 results, with net sales of $763.2 million, adjusted diluted earnings per share of $3.66, and diluted EPS of $3.53. Both metrics significantly exceeded analyst expectations, with adjusted EPS beating the consensus estimate of $3.33 by 9.91% and sales surpassing the $725.754 million forecast by 5.16%. Building on this strong first-half performance, the company has raised its full year 2026 sales and margin outlook.
CEO Robert J. Pagano Jr. commented: "We delivered another strong quarter, achieving record sales, operating income and EPS, with double-digit organic growth. These results reflect the strength of our diversified portfolio, disciplined execution, and our ability to capture long-term growth opportunities. Building on our first half performance, we are increasing our full year 2026 sales and margin outlook. While the trade and geopolitical environments remain dynamic, our teams continue to execute well and remain focused on serving our customers."
Second Quarter Financial Performance
The following table summarizes key second quarter financial metrics compared to the prior year period (second quarter 2025):
| Metric: | Q2 2026 | Q2 2025 | Change |
|---|---|---|---|
| Net Sales: | $763.2M | $643.7M | +19% reported; +12% organic |
| Operating Income: | $154.0M | $135.3M | +14% |
| Operating Margin: | 20.2% | 21.0% | -80 bps |
| Adjusted Operating Income: | $160.0M | $139.1M | +15% |
| Adjusted Operating Margin: | 21.0% | 21.6% | -60 bps |
| Diluted EPS: | $3.53 | $3.01 | +17% |
| Adjusted Diluted EPS: | $3.66 | $3.09 | +18% |
| Net Income: | $118.3M | $100.9M | — |
Sales of $763 million increased 19% on a reported basis and 12% on an organic basis, primarily due to favorable price realization and higher volume driven by data center growth. Acquisition sales within the Americas and APMEA contributed $34 million, or 5%, to reported sales growth, while favorable foreign exchange contributed $7 million, or 1%. Operating and adjusted operating margins declined primarily due to acquisition dilution, inflation, tariffs, and a difficult comparison against a one-time tariff-related price/cost benefit in the prior year, partly offset by favorable price realization, sales volume leverage, and productivity.
Regional Performance
The following table presents second quarter net sales and segment margins by region:
| Region: | Q2 2026 Net Sales | Q2 2025 Net Sales | Reported Growth | Organic Growth | Segment Margin (Q2 2026) | Segment Margin (Q2 2025) |
|---|---|---|---|---|---|---|
| Americas: | $585.0M | $498.5M | +17% | +12% | 25.7% | 27.2% |
| Europe: | $124.6M | $111.0M | +12% | +9% | 13.3% | 11.7% |
| APMEA: | $53.6M | $34.2M | +57% | +31% | 19.9% | 18.9% |
Americas sales growth was driven by favorable price realization and higher data center volumes, with acquisition sales contributing $28 million, or 6%, to reported growth. Segment margin decreased 150 basis points primarily due to acquisition dilution, inflation, and tariffs. Europe sales grew on higher volumes and favorable price realization, with favorable foreign exchange contributing 3% to reported growth; segment margin increased 160 basis points. APMEA saw strong organic growth of 31%, primarily driven by data center growth in China, partly offset by a decline in the Middle East; acquisition sales contributed $6 million, or 17%, and segment margin increased 100 basis points.
Six-Month Results and Cash Flow
For the six months ended June 28, 2026, net sales were $1,440.4 million compared to $1,201.7 million in the prior year period. Net income for the first half was $217.9 million versus $174.9 million. Operating cash flow was $120.8 million and net capital expenditure was $22.6 million, resulting in free cash flow of $98.2 million. In the comparable prior year period, operating cash flow was $124.9 million, net capital expenditure was $19.8 million, and free cash flow was $105.1 million. Free cash flow declined due to higher working capital levels and increased capital expenditures, which more than offset higher net income.
The company repurchased approximately 13,000 shares of Class A common stock at a cost of $4.1 million during the second quarter. Approximately $121 million remains available under the stock repurchase program authorized in 2023, which has no expiration date.
Full Year 2026 Outlook
The company raised its full year 2026 guidance as follows:
| Metric: | Updated Outlook |
|---|---|
| Net Sales Growth (Reported): | Up 14% to up 17% |
| Organic Sales Growth: | Up 8% to up 11% |
| Operating Margin: | 19.4% to 20.0% (up 100 to up 160 bps) |
| Adjusted Operating Margin: | 19.8% to 20.4% (up 20 to up 80 bps) |
The full year outlook assumes no change in the level of impact from the Middle East conflict and incorporates the estimated impact of tariffs in place or announced as of August 4, 2026. The outlook does not include the impact of tariff refunds; any tariff refunds received in future periods will be treated as non-recurring special items and excluded from adjusted results. Sequential increases in free cash flow are expected in the second half of 2026 as the company monetizes working capital with the seasonality of the business.

How might the company's strategy for mitigating tariff impacts evolve if geopolitical tensions escalate further in the second half of 2026?
Given the significant margin compression in the Americas region, what specific operational levers is management pulling to restore profitability to pre-acquisition levels?
To what extent will the sustained demand from data center infrastructure projects continue to drive organic growth versus cannibalizing other product lines?
 19
19






 Access Market Heat-map & Insights
  Create, Save & Share your Screener
  Use 200+ Screening Filters





