

VMS Industries Q1FY27 net profit rises 6.4% to ₹46.26 lakh


VMS Industries posted a 6.4% YoY net profit increase to ₹46.26 lakh in Q1FY27, supported by 13.1% revenue growth to ₹4,482.59 lakh. Operating margins improved slightly to 2.79%, while inventory purchases surged significantly, potentially signaling preparation for future contracts. The company also confirmed regulatory compliance by publishing its results in national and regional newspapers.


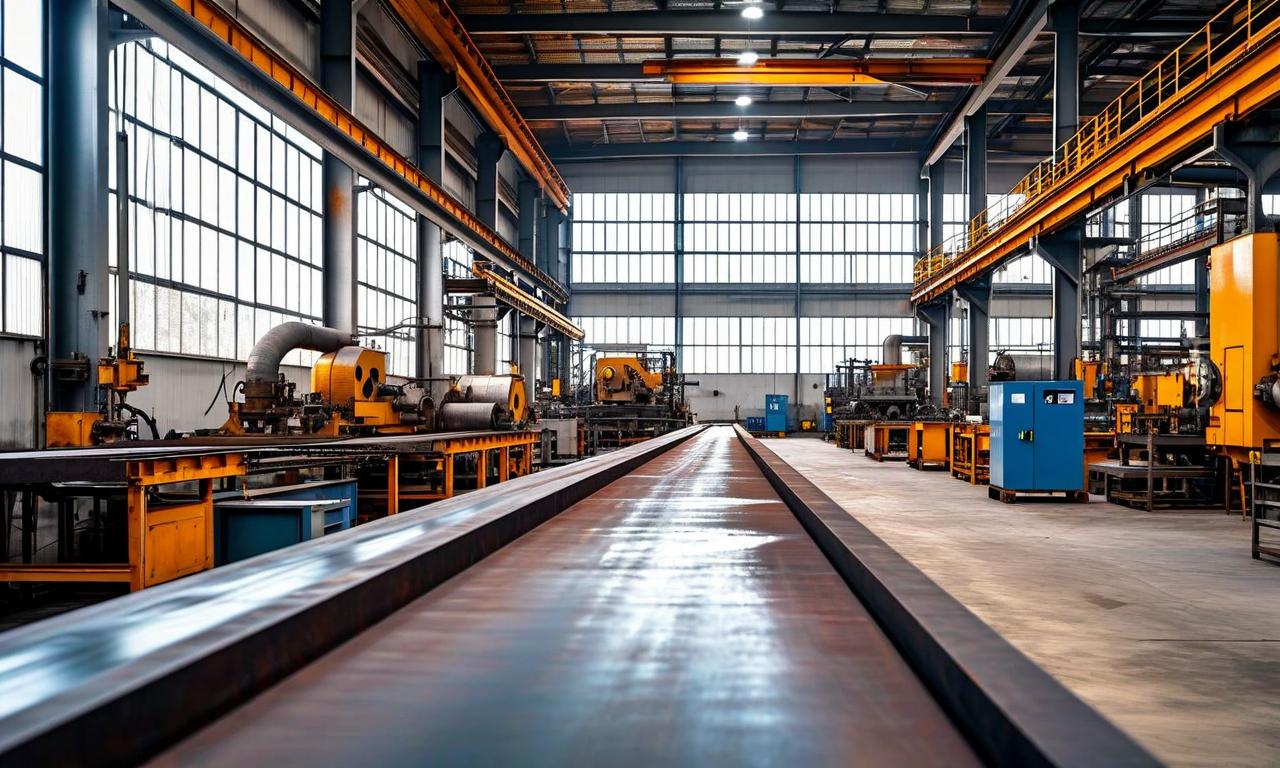
*this image is generated using AI for illustrative purposes only.
VMS Industries reported a net profit of ₹46.26 lakh for the first quarter ended June 30, 2026, up 6.4% from ₹43.47 lakh in Q1FY26. The green ship recycling company saw revenue from operations rise 13.1% year-on-year to ₹4,482.59 lakh, driven by increased activity in its core segment. The Board of Directors, chaired by Managing Director Manoj Kumar Jain, approved the unaudited standalone financial results on August 12, 2026, pursuant to Regulation 30 of the SEBI (Listing Obligations and Disclosure Requirements) Regulations, 2015.
The statutory auditors, S N Shah & Associates, Chartered Accountants, issued a limited review report on the financial statements. The results were prepared in accordance with Indian Accounting Standard 34 (Ind AS 34) and reviewed under Standard on Review Engagements (SRE) 2410. The company also filed an integrated XBRL form for related party transactions for the quarter.
Financial Performance Highlights
VMS Industries demonstrated improved top-line growth while maintaining stable profitability metrics. Total income reached ₹4,635.35 lakh, compared to ₹4,118.21 lakh in the corresponding period of the previous year. Other income remained relatively flat at ₹152.76 lakh, slightly down from ₹153.79 lakh in Q1FY26.
| Particulars | Q1FY27 (₹ Lakh) | Q1FY26 (₹ Lakh) | YoY Change |
|---|---|---|---|
| Revenue from Operations | 4,482.59 | 3,964.42 | +13.1% |
| Total Income | 4,635.35 | 4,118.21 | +12.6% |
| Total Expenses | 4,571.16 | 4,057.48 | +12.7% |
| Profit Before Tax | 64.19 | 60.73 | +5.7% |
| Net Profit After Tax | 46.26 | 43.47 | +6.4% |
| EPS (Basic/Diluted) | ₹0.76 | ₹0.71 | +7.0% |
Earnings per share (EPS) stood at ₹0.76, an increase from ₹0.71 in the same quarter last year. The company’s paid-up equity share capital remained unchanged at ₹2,447.34 lakh.
What the Numbers Show
The improvement in net profit was primarily driven by revenue growth rather than margin expansion. Operating margin increased slightly to 2.79% from 2.57% in Q1FY26, indicating modest efficiency gains despite a significant rise in purchase of stock-in-trade, which jumped to ₹3,534.48 lakh from ₹1,472.89 lakh year-on-year. This surge in inventory purchases suggests preparation for larger recycling contracts or strategic stockpiling, though it contributed to higher total expenses. Cost of materials consumed decreased significantly to ₹811.80 lakh from ₹1,895.94 lakh, offsetting some of the inventory build-up costs.
Key Ratios and Balance Sheet Metrics
The company’s debt-equity ratio rose to 0.86 from 0.76 in Q1FY26, reflecting increased leverage relative to equity. However, the interest service coverage ratio improved to 2.34 from 2.95, showing adequate earnings to cover interest obligations. Net worth increased to ₹9,800.88 lakh from ₹9,371.93 lakh in the previous comparable period.
| Ratio | Q1FY27 | Q1FY26 |
|---|---|---|
| Debt-Equity Ratio | 0.86 | 0.76 |
| Interest Service Coverage | 2.34 | 2.95 |
| Current Ratio | 2.27 | 2.27 |
| Operating Margin % | 2.79% | 2.57% |
| Net Profit Margin % | 1.03% | 1.10% |
The current ratio remained stable at 2.27, indicating consistent short-term liquidity. The debtors turnover ratio declined to 0.65 from 1.48, suggesting slower collection cycles or changes in credit terms, while inventory turnover improved to 3.03 from 0.95, reflecting faster movement of goods relative to average inventory levels.
Regulatory Compliance Update
Pursuant to Regulation 47 of the SEBI (Listing Obligations and Disclosure Requirements) Regulations, 2015, VMS Industries intimated the publication of its Q1FY27 financial results in newspapers. The advertisement was published on August 13, 2026, in Indian Express (English language, National Daily) and Financial Express (Regional language Gujarati). The Company Secretary & Compliance Officer, Hemal Patel, signed the intimation dated August 14, 2026, confirming that the results were approved by the Board on August 12, 2026, and filed with stock exchanges on the same day.
Historical Stock Returns for VMS Industries
| 1 Day | 5 Days | 1 Month | 6 Months | 1 Year | 5 Years |
|---|---|---|---|---|---|
| +0.17% | -1.04% | -2.65% | -25.85% | -45.42% | +58.82% |

How will the significant increase in stock-in-trade purchases impact VMS Industries' working capital requirements and cash flow in the upcoming quarters?
What strategic initiatives is the company pursuing to address the decline in debtors turnover ratio and improve collection efficiency?
Given the rise in the debt-equity ratio to 0.86, what are VMS Industries' plans for debt management or equity raising in the near term?
 17
17












 Access Market Heat-map & Insights
  Create, Save & Share your Screener
  Use 200+ Screening Filters





