

Virat Industries Q1FY27 net profit doubles to ₹21 million on margin gains


Virat Industries posted a net profit of ₹21 million in Q1FY27, up from ₹9 million in Q1FY26. Revenue grew 10.5% to ₹95 million. The significant divergence between revenue and profit growth points to margin expansion. Results were approved on August 13, 2026.


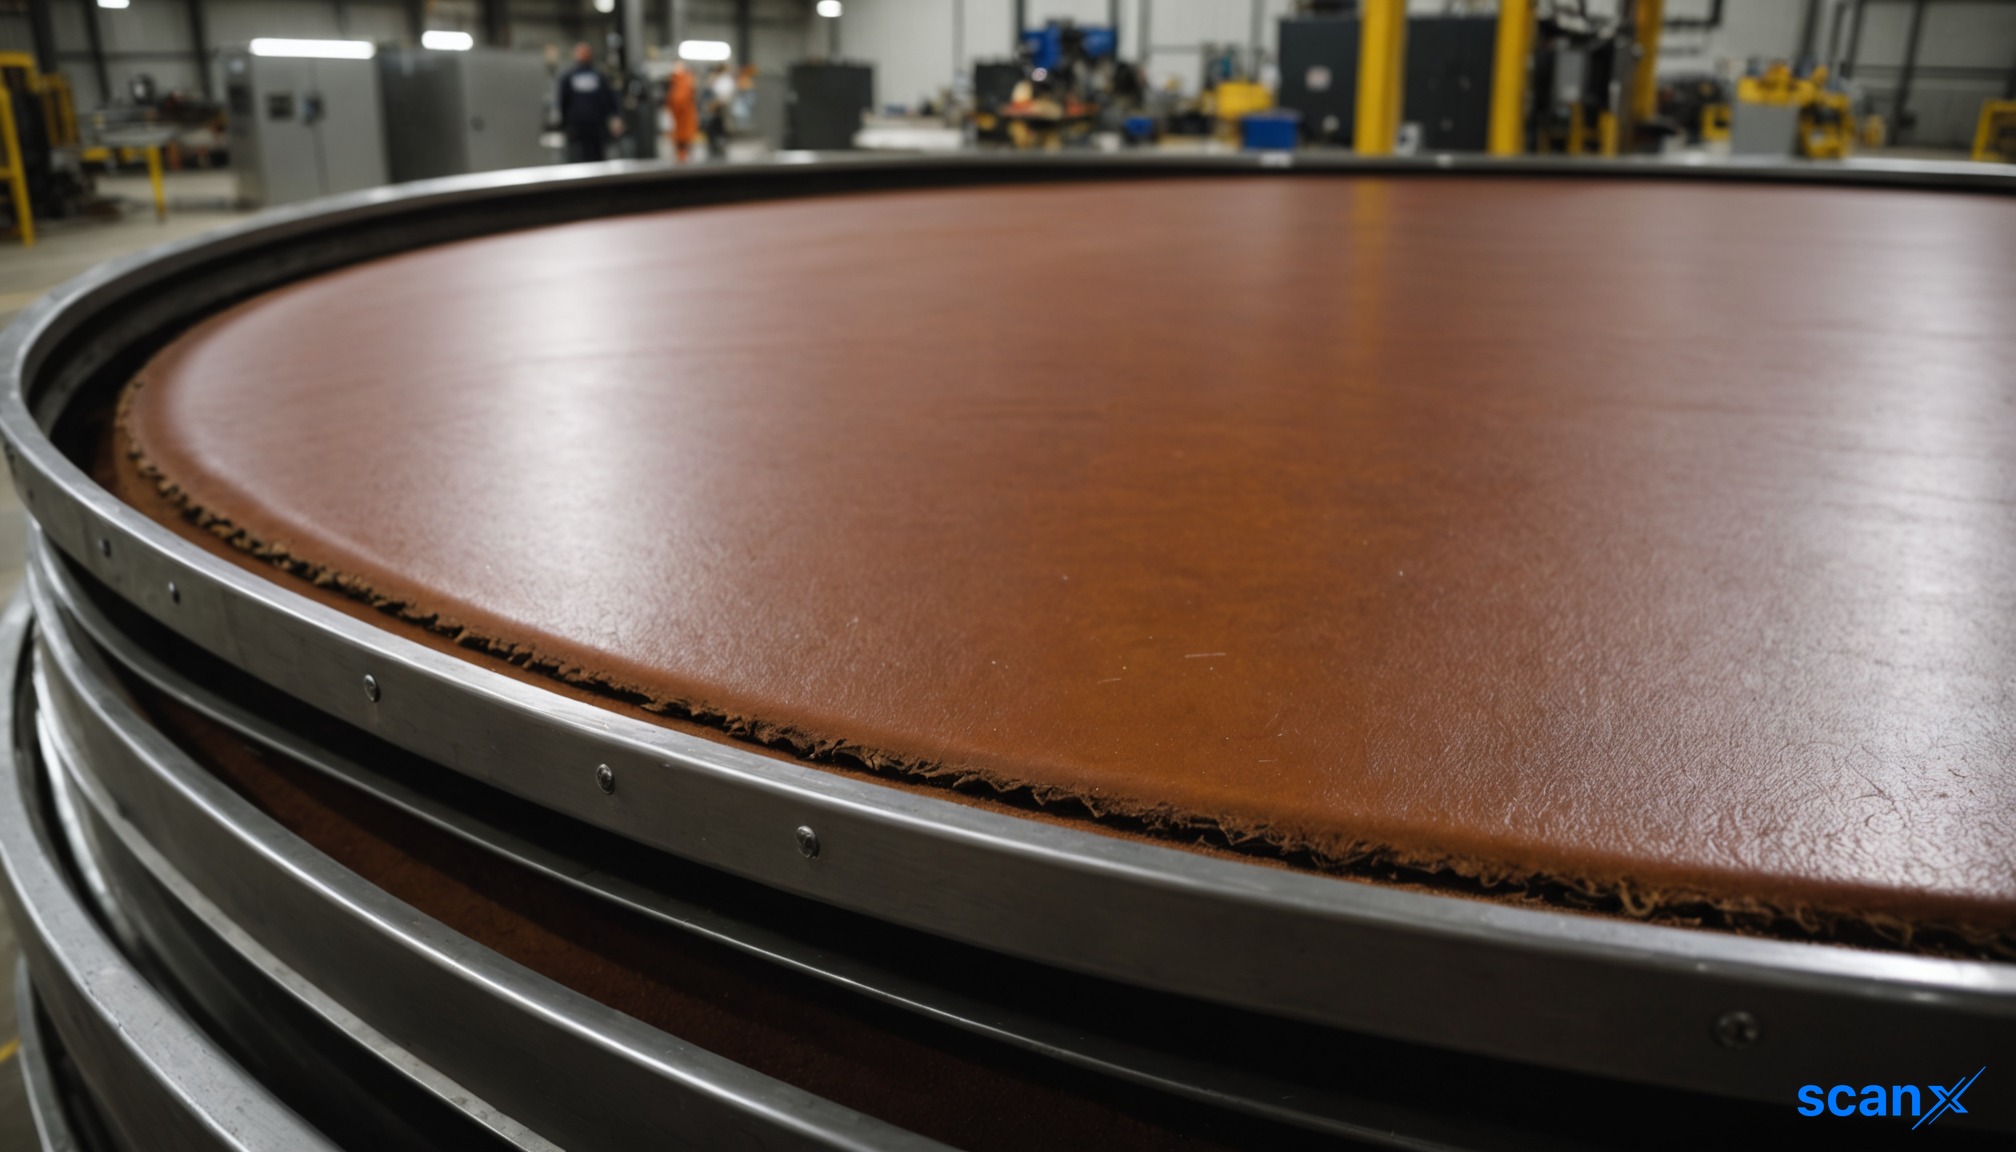
*this image is generated using AI for illustrative purposes only.
Virat Industries reported a substantial increase in net profit for the first quarter of FY27, driven by operational gains that significantly outpaced top-line growth.
The company logged a net profit of ₹21 million for the quarter ended June 30, 2026, compared to ₹9 million in the corresponding period of the previous fiscal year. This represents a more than doubling of bottom-line results year-over-year.
Financial Performance
Revenue also expanded during the quarter, reaching ₹95 million against ₹86 million recorded in the prior year. The divergence between the percentage growth in revenue and the sharper rise in net profit suggests an expansion in operating margins or improved cost control measures during the period.
| Metric: | Q1FY27 | Q1FY26 | Change |
|---|---|---|---|
| Revenue: | ₹95 million | ₹86 million | +10.5% |
| Net Profit: | ₹21 million | ₹9 million | +133.3% |
The Board of Directors approved the un-audited standalone financial results on August 13, 2026. The results were filed with stock exchanges pursuant to Regulation 47 of SEBI (LODR) Regulations, 2015. A subsequent clarification noted that while the newspaper advertisement inadvertently mentioned "quarter and year ended," the financial results pertained strictly to the quarter ended June 30, 2026, with no change in the figures published.
What the Numbers Show
The data indicates a strong leverage effect on profitability. While revenue grew by roughly 10%, net profit surged by over 130%. This disparity highlights that the improvement in earnings was not merely volume-driven but likely benefited from margin expansion or favorable one-off items, although specific breakdowns of other income or tax rates were not disclosed in the filing.
Historical Stock Returns for Virat Industries
| 1 Day | 5 Days | 1 Month | 6 Months | 1 Year | 5 Years |
|---|---|---|---|---|---|
| -0.29% | -9.92% | -27.22% | +1.25% | +1.25% | +1.25% |

Will Virat Industries sustain its current margin expansion trajectory in Q2FY27, or was the profit surge driven by non-recurring one-off gains?
How does the company plan to allocate the increased cash flows from higher profitability between debt reduction, capital expenditure, or shareholder returns?
Are there specific operational efficiencies or cost-control measures implemented in Q1 that can be scaled across other business units in the coming quarters?
 17
17






 Create Custom Screeners
  Access 200+ Pre-built Filters
  Use 50+ Readymade Screener





