

Syrma SGS Technology Q4FY26: Revenue Up 56% YoY, PAT Surges 87% for FY26


Syrma SGS Technology's Board approved audited FY26 results on May 11, 2026, with consolidated Q4FY26 revenue at Rs. 14,650.12 mn (up 56% YoY) and PAT at Rs. 1,192.31 mn. Full-year FY26 consolidated PAT surged 87.50% YoY to Rs. 3,458.06 mn, with EBITDA up 56.20% YoY to Rs. 5,823 mn. Key developments include a Rs. 10,000 mn QIP, acquisition of 60% stake in Elcome for Rs. 2,350 mn, and a recommended final dividend of Rs. 1.50 per share.


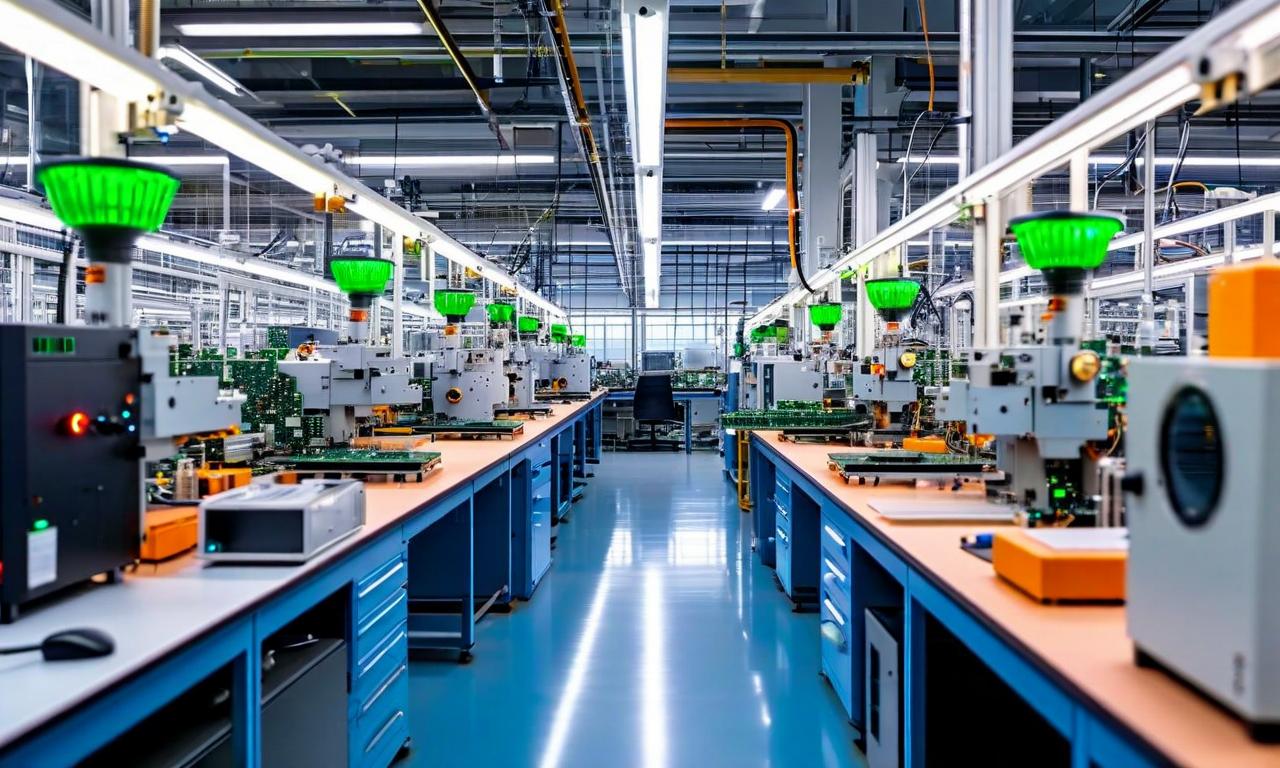
*this image is generated using AI for illustrative purposes only.
Syrma SGS Technology Limited's Board of Directors, at its meeting held on May 11, 2026, approved the audited standalone and consolidated financial results for the quarter and financial year ended March 31, 2026, under Regulation 30 and 33 of the SEBI (Listing Obligations and Disclosure Requirements) Regulations, 2015. The statutory auditors, M/s Walker Chandiok & Co LLP, issued an unmodified audit opinion on both standalone and consolidated financial results. The board also recommended a final dividend of Rs. 1.50 per equity share (15% on face value of Rs. 10 each) for FY26, subject to shareholder approval at the ensuing Annual General Meeting.
Consolidated Financial Performance
On a consolidated basis, Syrma SGS Technology and its subsidiaries reported robust growth for the year ended March 31, 2026. The Group operates in a single reportable segment — Electronics Manufacturing Services (EMS). For Q4FY26, consolidated revenue from operations stood at Rs. 14,650.12 million, up from Rs. 9,243.61 million in Q4FY25, while consolidated net profit came in at Rs. 1,192.31 million versus Rs. 714.53 million in the year-ago period. EBITDA for Q4FY26 was Rs. 1,700 million compared to Rs. 1,160 million in Q4FY25, with EBITDA margin at 11.89% versus 12.52% YoY. For the full year FY26, consolidated total revenue reached Rs. 48,569 million, up 26.60% YoY, while EBITDA expanded to Rs. 5,823 million, up 56.20% YoY. Key consolidated financial metrics are presented below:
| Metric: | Q4FY26 | Q3FY26 | Q4FY25 | QoQ Change | YoY Change | FY26 | FY25 | YoY Change |
|---|---|---|---|---|---|---|---|---|
| Total Revenue (Rs. mn): | 14,768 | 12,745 | 9,466 | 15.90% | 56.00% | 48,569 | 38,361 | 26.60% |
| EBITDA (Rs. mn): | 1,700 | 1,697 | 1,160 | — | — | 5,823 | 3,727 | 56.20% |
| EBITDA Margin: | 11.89% | 13.30% | 12.52% | — | — | 12.00% | 9.70% | 230 bps |
| PAT (Rs. mn): | 1,010 | 1,103 | 654 | — | — | 3,458 | 1,845 | 87.50% |
| PAT Margin: | — | 8.70% | 7.50% | — | — | 7.10% | 4.80% | 230 bps |
The detailed consolidated results from the audited financials are as follows:
| Metric: | Q4 FY26 | Q4 FY25 | FY26 (Audited) | FY25 (Audited) |
|---|---|---|---|---|
| Revenue from Operations (Rs. mn): | 14,650.12 | 9,243.61 | 48,190.59 | 37,866.91 |
| Total Income (Rs. mn): | 14,768.46 | 9,466.35 | 48,546.66 | 38,361.15 |
| Total Expenses (Rs. mn): | 13,252.75 | 8,532.64 | 44,069.17 | 35,969.02 |
| Profit Before Tax (Rs. mn): | 1,503.81 | 933.71 | 4,453.76 | 2,370.75 |
| Profit After Tax (Rs. mn): | 1,192.31 | 714.53 | 3,458.06 | 1,844.50 |
| Total Comprehensive Income (Rs. mn): | 1,226.05 | 711.82 | 3,520.71 | 1,821.82 |
| Basic EPS (Rs.): | 5.29 | 3.67 | 16.94 | 9.55 |
| Diluted EPS (Rs.): | 5.28 | 3.67 | 16.92 | 9.52 |
Profit attributable to owners of the holding company for FY26 stood at Rs. 3,177.80 million, compared to Rs. 1,698.71 million in FY25. Non-controlling interests accounted for Rs. 280.26 million of the consolidated profit after tax. Exceptional items of Rs. 45.73 million were recognised at the consolidated level for FY26 on account of the New Labour Codes. Total consolidated assets stood at Rs. 57,700.07 million as at March 31, 2026, against Rs. 42,046.71 million in the prior year. Export revenue contributed 25% of revenue from operations for both Q4FY26 and FY26, growing 33% YoY and 41% YoY respectively.
Standalone Financial Performance
On a standalone basis, Syrma SGS Technology delivered a strong performance for the full year ended March 31, 2026. Revenue from operations grew significantly compared to the prior year, while profitability improved across key metrics. The following table summarises the standalone financial highlights:
| Metric: | Q4 FY26 | Q4 FY25 (Restated) | FY26 (Audited) | FY25 (Audited, Restated) |
|---|---|---|---|---|
| Revenue from Operations (Rs. mn): | 12,207.26 | 8,637.94 | 43,671.54 | 36,157.51 |
| Total Income (Rs. mn): | 12,317.14 | 8,754.42 | 44,079.22 | 36,630.15 |
| Total Expenses (Rs. mn): | 11,311.18 | 7,967.90 | 40,326.91 | 34,497.29 |
| Profit Before Tax (Rs. mn): | 999.54 | 786.52 | 3,719.84 | 2,112.86 |
| Profit After Tax (Rs. mn): | 808.88 | 608.51 | 2,933.69 | 1,686.59 |
| Total Comprehensive Income (Rs. mn): | 820.66 | 592.65 | 2,941.88 | 1,659.62 |
| Basic EPS (Rs.): | 4.21 | 3.42 | 15.64 | 9.49 |
| Diluted EPS (Rs.): | 4.20 | 3.41 | 15.62 | 9.45 |
For the full year, total income rose to Rs. 44,079.22 million from Rs. 36,630.15 million in the prior year. Profit after tax for FY26 stood at Rs. 2,933.69 million, compared to Rs. 1,686.59 million in FY25. Exceptional items of Rs. 32.47 million were recognised during FY26, primarily on account of the implementation of the New Labour Codes effective November 21, 2025. Paid-up equity share capital stood at Rs. 1,926.25 million as at March 31, 2026, with other equity (reserves) at Rs. 27,689.36 million.
Balance Sheet and Cash Flow Highlights
The standalone balance sheet reflects a significant strengthening of the equity base. Total standalone equity rose to Rs. 29,615.61 million as at March 31, 2026, from Rs. 17,263.55 million a year earlier. Standalone cash and cash equivalents increased to Rs. 1,647.46 million from Rs. 679.52 million. Net cash flow from standalone operating activities for FY26 was Rs. 2,525.76 million, compared to Rs. 1,452.01 million in FY25. On the consolidated front, net cash flow from operating activities was Rs. 2,895.65 million versus Rs. 1,764.63 million in FY25, while consolidated cash and cash equivalents closed at Rs. 1,922.81 million.
| Balance Sheet Metric: | Standalone FY26 | Standalone FY25 (Restated) | Consolidated FY26 | Consolidated FY25 |
|---|---|---|---|---|
| Total Assets (Rs. mn): | 52,352.10 | 40,171.02 | 57,700.07 | 42,046.71 |
| Total Equity (Rs. mn): | 29,615.61 | 17,263.55 | 30,654.69 | 18,248.19 |
| Total Liabilities (Rs. mn): | 22,736.49 | 22,907.47 | 27,045.38 | 23,798.52 |
| Cash & Cash Equivalents (Rs. mn): | 1,647.46 | 679.52 | 1,922.81 | 808.57 |
Management Commentary
Commenting on the results, Mr. Jasbir Singh Gujral, Managing Director of Syrma SGS Technology, said: "FY26 was a strong year of execution for Syrma SGS. We delivered 27% revenue growth to ₹4,819 Cr, with operating EBITDA expanding significantly to ₹545 Cr, ahead of what we had indicated at the start of the year. Importantly, this growth was delivered with positive operating cash flow and a meaningful reduction in net working capital days, reflecting stronger execution and capital discipline. The year also marked important progress on our strategic agenda. We strengthened our presence in higher-quality verticals such as Automotive, Industrial, Healthcare and Defence, while exports grew 41% and crossed ₹1,200 Cr, reflecting growing global confidence in our capabilities. With the consolidation of Elcome in Defence, the Elemaster JV in high-reliability Industrial & Railways electronics, and our foray into the component ecosystem through the PCB project, we are building new growth verticals that make Syrma SGS a broader and more resilient electronics manufacturing platform for FY27 and beyond."
Key Corporate Developments
During FY26, Syrma SGS Technology raised Rs. 10,000.00 million through a Qualified Institutional Placement (QIP), issuing 14,306,151 equity shares of face value Rs. 10 each at a premium of Rs. 689 per share. All proceeds have been utilised in accordance with the placement document. The company also executed agreements to acquire a 60% stake in Elcome Integrated Systems Private Limited for a total consideration of Rs. 2,350.00 million, with the remaining 40% to be acquired in a phased manner. Additionally, Syrma SGS Technology made an additional investment of Rs. 360.03 million in Syrma Strategic Electronics Private Limited (now renamed Shinhyup Syrma Circuits Private Limited), retaining a 75% equity stake following the issuance of shares to SH Electronics Co. Limited for Rs. 120.00 million. The NCLT-approved scheme of amalgamation of wholly-owned subsidiaries SGS Tekniks Manufacturing Private Limited and SGS Infosystems Private Limited with the company, with an appointed date of April 1, 2023, has been given effect in the standalone financial results, with comparative figures restated accordingly. As at March 31, 2026, unutilised IPO proceeds of Rs. 443.72 million remained temporarily invested in fixed deposits with scheduled commercial banks.
Historical Stock Returns for Syrma SGS
| 1 Day | 5 Days | 1 Month | 6 Months | 1 Year | 5 Years |
|---|---|---|---|---|---|
| +0.40% | +0.51% | +6.43% | +103.76% | +110.12% | +456.10% |

How will the full consolidation of Elcome Integrated Systems and the Elemaster JV contribute to Syrma SGS's revenue mix and margin profile in FY27, particularly in the Defence and high-reliability electronics segments?
Given the EBITDA margin compression from 13.30% in Q3FY26 to 11.89% in Q4FY26, what structural cost pressures or pricing dynamics could challenge the company's ability to sustain its 12% full-year margin target going forward?
With exports already crossing ₹1,200 Cr and growing 41% YoY, which geographies or customer verticals are most likely to drive the next phase of international expansion, especially amid evolving global supply chain realignments?
 16
16



 Access 50+ Readymade Screeners
  Use 200+ Custom Filters
  Get Full Market Insights





