

Syncom Formulations net profit rises 57.7% in Q1FY27 on margin expansion


Syncom Formulations (India) Limited delivered strong Q1FY27 results with consolidated net profit rising 57.7% to ₹2484.68 lakh. Revenue grew 7.3% to ₹12552.64 lakh, but the primary driver was margin expansion, with EBITDA margins jumping to 20.87%. The company demonstrated effective cost control, reducing standalone expenses despite higher income.


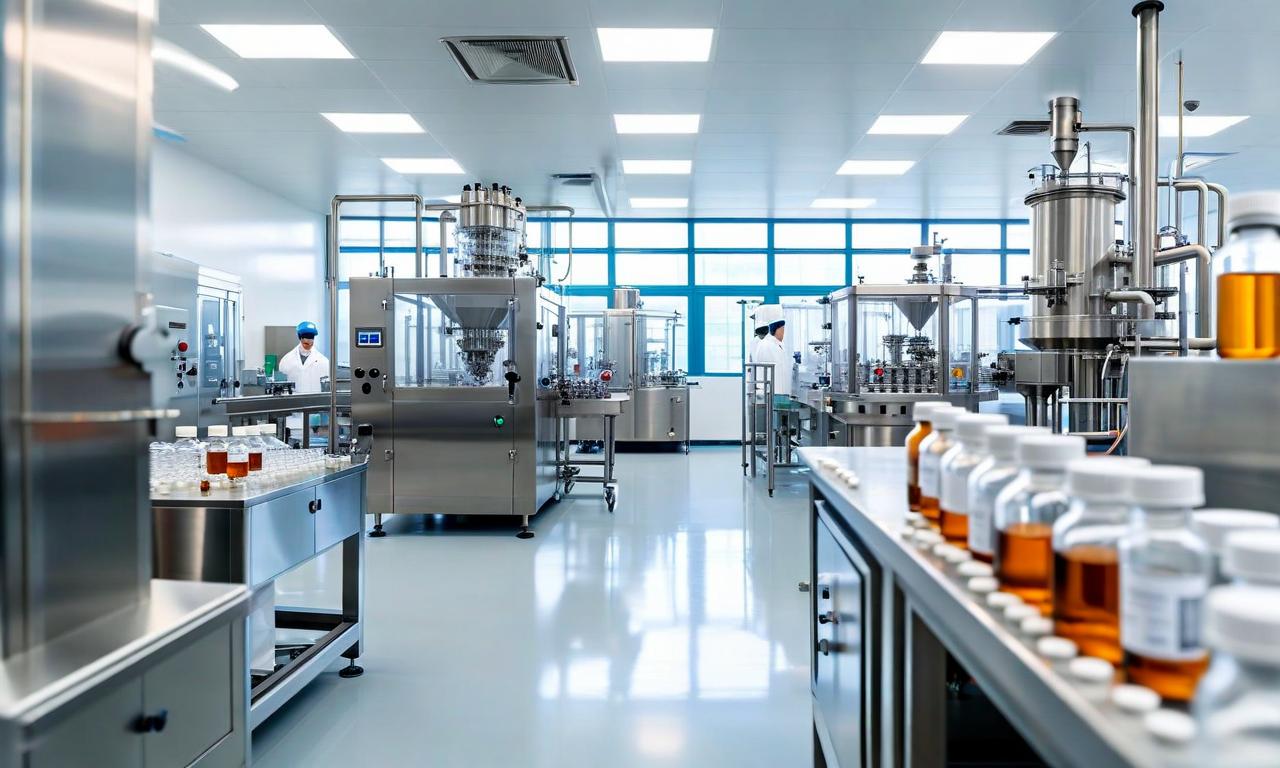
*this image is generated using AI for illustrative purposes only.
Syncom Formulations (India) Limited reported a consolidated net profit of ₹2484.68 lakh for the quarter ended June 30, 2026, marking a 57.7% year-on-year increase from ₹1575.44 lakh in Q1FY26. The pharmaceutical manufacturer’s standalone net profit rose 56.3% to ₹2458.92 lakh, driven by improved operating leverage and significant expansion in EBITDA margins. This performance highlights strong profitability in its core drugs and formulations segment amidst moderate revenue growth.
The Board of Directors approved the unaudited financial results at a meeting held on August 11, 2026, in Indore. The results were reviewed by the Audit Committee and subjected to a limited review by statutory auditors Sanjay Mehta & Associates, in compliance with Regulation 33 of the SEBI (LODR) Regulations, 2015. Chairman and Wholetime Director Ankit Kedarmal Bankda signed off on the filings, which were subsequently submitted to the BSE and NSE. The company also published the extract of results in the Free Press Journal on August 12, 2026.
Financial Performance Highlights
Standalone revenue from operations grew 6.9% YoY to ₹12465.95 lakh, up from ₹11654.69 lakh in Q1FY26. Total income stood at ₹13247.75 lakh, compared to ₹12256.66 lakh in the prior year period. On a consolidated basis, revenue from operations increased 7.3% YoY to ₹12552.64 lakh, while total income reached ₹13335.58 lakh. The consolidated EBITDA margin expanded significantly to 20.87% from 13.52% in the year-ago period, reflecting strong operating leverage and improved cost efficiency.
The following table summarises key financial metrics across both standalone and consolidated bases:
| Metric (₹ Lakh) | Standalone Q1FY27 | Standalone Q1FY26 | Consolidated Q1FY27 | Consolidated Q1FY26 |
|---|---|---|---|---|
| Revenue from Operations | 12465.95 | 11654.69 | 12552.64 | 11690.17 |
| Total Income | 13247.75 | 12256.66 | 13335.58 | 12293.64 |
| Net Profit | 2458.92 | 1572.93 | 2484.68 | 1575.44 |
| EBITDA (PBT + Depreciation) | 3344.91 | 2155.70 | 3379.25 | 2163.24 |
| EBITDA Margin (%) | — | — | 20.87 | 13.52 |
| Basic EPS (₹) | 0.26 | 0.17 | 0.26 | 0.17 |
Profit before tax on a standalone basis was ₹3190.88 lakh, up from ₹2025.83 lakh in Q1FY26. Consolidated profit before tax rose to ₹3225.22 lakh from ₹2029.24 lakh. Tax expense remained stable at ₹731.96 lakh (standalone) and ₹740.54 lakh (consolidated), resulting in effective tax rates of approximately 22.9% for both bases.
Segment-Wise Breakdown
The Pharmaceuticals Drugs & Formulations segment contributed ₹13135.78 lakh (standalone) and ₹13223.61 lakh (consolidated) to total segment revenue, representing over 99% of income. This segment generated a pre-tax profit of ₹3134.50 lakh (standalone) and ₹3170.25 lakh (consolidated), demonstrating strong operational efficiency.
Trading of Commodities and Renting of Property contributed minimally, with combined revenues of ₹111.97 lakh (standalone) and ₹111.97 lakh (consolidated). Segment assets totaled ₹54761.88 lakh (standalone) and ₹55298.95 lakh (consolidated), reflecting continued investment in manufacturing infrastructure and property holdings.
What the Numbers Show
A key analytical observation is the divergence between revenue growth and expense management. While revenue grew nearly 7%, total expenses decreased slightly on a standalone basis from ₹10234.96 lakh to ₹10056.87 lakh, indicating improved cost control. This efficiency gain significantly amplified profit margins, with PBT margins expanding from 17.3% to 24.1%. Additionally, the company corrected its EPS calculation method to comply with Ind AS 33, restating comparative EPS from ₹0.21 to ₹0.17 for Q1FY26 to reflect profit after tax rather than total comprehensive income.
Historical Stock Returns for Syncom Formulations
| 1 Day | 5 Days | 1 Month | 6 Months | 1 Year | 5 Years |
|---|---|---|---|---|---|
| +0.10% | +6.76% | +16.71% | +76.34% | +16.84% | +147.53% |

Can the significant EBITDA margin expansion from 13.52% to 20.87% be sustained in subsequent quarters, or was it driven by one-off cost efficiencies?
What specific strategies is Syncom Formulations pursuing to accelerate top-line revenue growth beyond the current 7% year-on-year rate?
How might the company's heavy reliance on the Pharmaceuticals Drugs & Formulations segment (>99% of revenue) expose it to regulatory or pricing risks in the near future?
 16
16





 Access 50+ Readymade Screeners
  Use 200+ Custom Filters
  Get Full Market Insights





