

Sundram Fasteners posts 20% revenue rise in Q1FY27, PAT up 14% to ₹168.69 crore


Sundram Fasteners delivered strong Q1FY27 results with revenue rising 20% to ₹1,846.07 crore and PAT increasing 14% to ₹168.69 crore. Export growth drove performance despite EBITDA margin contraction. The company continues its strategic capex push into non-auto sectors like aerospace and wind energy.


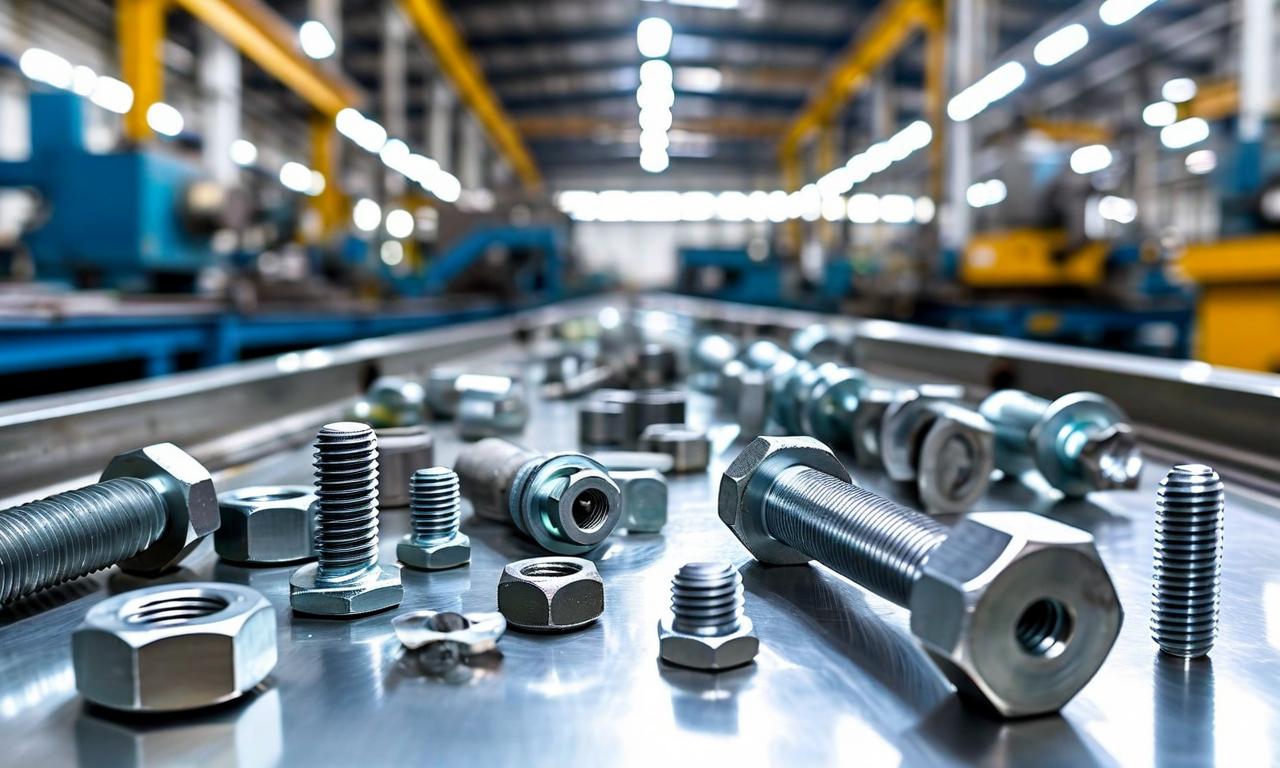
*this image is generated using AI for illustrative purposes only.
Sundram Fasteners Limited reported a 20% year-on-year increase in consolidated revenue from operations to ₹1,846.07 crore for the quarter ended June 30, 2026, driven by robust demand in both domestic and export markets. Consolidated net profit after tax (PAT) rose 14% to ₹168.69 crore, reflecting steady operational performance despite margin compression. The Board of Directors approved the unaudited financial results on August 4, 2026, pursuant to Regulation 29 and Regulation 33 of the SEBI (Listing Obligations and Disclosure Requirements) Regulations, 2015.
Standalone revenue grew 20% to ₹1,614.76 crore, with domestic sales surging 16% to ₹1,084.31 crore and export sales jumping 23% to ₹465.97 crore. Standalone PAT increased to ₹150.97 crore from ₹138.35 crore in the corresponding period of the previous year. Statutory auditors M/s B S R & Co. LLP issued an unmodified limited review report on both standalone and consolidated figures. The company operates in a single reportable segment focused on automobile and industrial components.
Financial Performance
Consolidated earnings per share (EPS) stood at ₹8.01 for the quarter, up from ₹7.06 in the prior year quarter. On an annual basis, consolidated basic EPS reached ₹28.13, compared to ₹28.13 annualised in the prior year context provided in the filing notes. Standalone profit before tax (PBT) was ₹203.23 crore, compared to ₹185.68 crore in Q1FY26. The full-year consolidated net profit before tax stood at ₹801.18 crore for the year ended March 31, 2026.
The following table presents a consolidated view of key financial metrics:
| Metric | Standalone Q1FY27 | Standalone Q1FY26 | Consolidated Q1FY27 | Consolidated Q1FY26 |
|---|---|---|---|---|
| Revenue (₹ crore) | 1,614.76 | 1,350.17 | 1,846.07 | 1,533.39 |
| Net Profit (₹ crore) | 150.97 | 138.35 | 168.69 | 147.94 |
| EPS (₹) | 7.18 | 6.58 | 8.01 | 7.06 |
| EBITDA Metric | Q1FY27 | Q1FY26 |
|---|---|---|
| EBITDA (₹ billion) | 2.86 | 2.47 |
| EBITDA Margin (%) | 15.49% | 16.11% |
Strategic Initiatives and Capital Allocation
Ms. Arathi Krishna, Managing Director, highlighted the company's expansion into high-potential non-automotive sectors including aerospace, wind energy, railways, and defence. To support this diversification, Sundram Fasteners has earmarked capital expenditure of ₹400 crore for capacity expansion. This includes approximately ₹250 crore for the Fasteners Division to target wind energy and aerospace markets, and ₹100 crore for the Cast and Machined Assemblies business to enhance precision-engineering capabilities.
What the Numbers Show
The 20% revenue growth outpaced the 14% net profit growth, and the EBITDA margin contraction from 16.11% to 15.49% year-on-year points to higher operational costs relative to revenue expansion in the current quarter. However, the significant 23% rise in export sales indicates successful penetration into international markets, particularly Europe where electric vehicle adoption is accelerating. The company's focus on Industry 4.0 technologies, including AI and IoT, aims to improve productivity and quality systems.
Historical Stock Returns for Sundram Fasteners
| 1 Day | 5 Days | 1 Month | 6 Months | 1 Year | 5 Years |
|---|---|---|---|---|---|
| +1.76% | +0.37% | -10.14% | +44.54% | +12.34% | +19.29% |

How will the ₹400 crore capital expenditure for capacity expansion impact Sundram Fasteners' debt-to-equity ratio and free cash flow in FY27?
What specific timelines has management provided for achieving profitability in the new aerospace and wind energy segments compared to the established automotive division?
Given the EBITDA margin compression to 15.49%, what pricing power or cost-control measures are expected to restore margins to previous levels in subsequent quarters?
 20
20










 Access Market Heat-map & Insights
  Create, Save & Share your Screener
  Use 200+ Screening Filters





