

Stella-Jones Q2FY26 Results: EBITDA drops 12% to $167 million


- Sales rose slightly to CAD 1.042 billion, driven by utility products and crossarms acquisition
- Adjusted EBITDA fell 12% YoY to CAD 167 million, with margins contracting to 16%
- Utility product sales grew 7% to CAD 510 million, offsetting a 5% drop in residential lumber
- Operating cash flow remained strong at CAD 192 million, supporting debt reduction of over CAD 100 million in H1
- Management reaffirms three-year EBITDA margin target of 17.5%-18.5%, expecting H2 improvement



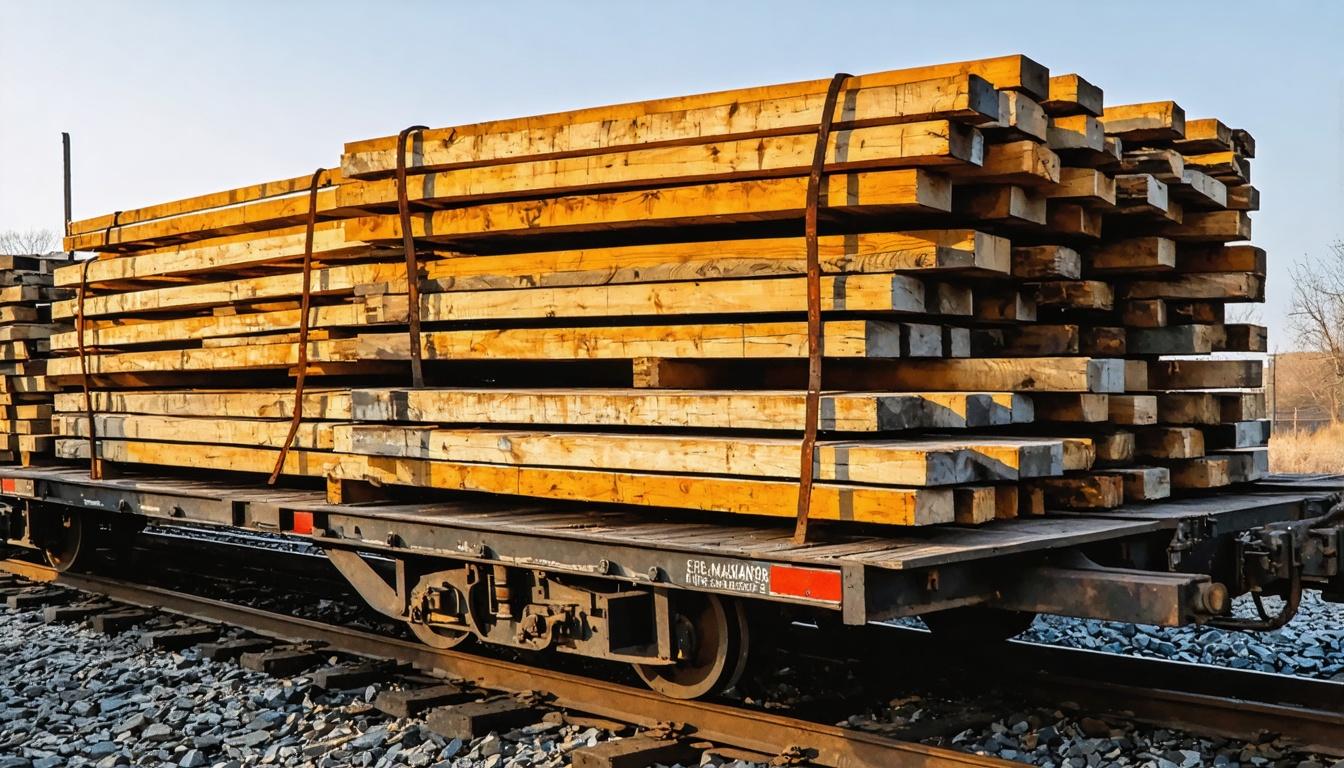
*this image is generated using AI for illustrative purposes only.
Stella-Jones Inc. (TSX: SJ) reported second-quarter 2026 adjusted EBITDA of CAD 167 million, down 12% year-over-year, as near-term cost pressures and temporary operational inefficiencies offset steady demand in utility products.
Sales for the quarter rose slightly to CAD 1.042 billion, up from CAD 1.034 billion in the prior-year period, driven by strength in wood utility poles and contributions from its recently acquired crossarms business.
Financial Performance
The company’s adjusted EBITDA margin contracted to 16% in Q2FY26, compared to 18.3% in Q2FY25. Management attributed the decline to site-specific environmental and maintenance costs, higher fuel expenses, and lagging pricing adjustments. Excluding non-recurring items, management noted margin performance would have been closer to 17.5%.
| Metric | Q2FY26 | Q2FY25 | Change |
|---|---|---|---|
| Sales | CAD 1.042 billion | CAD 1.034 billion | +0.8% |
| Adjusted EBITDA | CAD 167 million | CAD 189 million | -11.6% |
| EBITDA Margin | 16% | 18.3% | -230 bps |
Utility product sales grew 7% to CAD 510 million, supported by a CAD 29 million contribution from crossarms and modest organic growth in wood utility poles. Residential lumber sales declined 5% to CAD 234 million due to lower pricing and volumes.
Segment Updates
Wood utility pole volumes increased 2% organically, driven entirely by contract business, though unusually wet weather in Texas delayed some project execution. Railway tie sales fell to CAD 235 million from CAD 240 million, reflecting lower Class 1 volumes partially offset by commercial growth. The company recorded CAD 32 million in one-time charges related to network optimization, including CAD 24 million in non-cash asset write-downs.
Steel structure sales decreased due to temporary production losses during equipment changeovers at the Candiac facility. Management expects this disruption to be resolved by late August, with capacity ramping up toward 14,000 tons annualized in the second half of the year.
What the Numbers Show
Despite the decline in profitability, cash generation remained robust. Operating cash flow stood at CAD 192 million, down from CAD 224 million in the prior-year quarter but supported by favorable working capital dynamics, including seasonal inventory reductions. The company reduced net debt by more than CAD 100 million in the first half of the year, ending with CAD 759 million in available liquidity and a leverage ratio of 2.5 times.
Outlook
Management expects EBITDA margins to improve in the second half of 2026 as cost pressures ease and pricing adjustments take effect. The company reaffirmed its three-year average adjusted EBITDA margin target of 17.5% to 18.5%, citing ongoing network optimization initiatives expected to yield CAD 10 to 15 million in annual cost savings starting in 2027.

How will the resolution of the Candiac facility equipment changeovers in late August impact steel structure sales volumes and margins in Q3 2026?
What specific pricing mechanisms or contractual clauses does Stella-Jones have in place to accelerate the lagging pricing adjustments mentioned by management?
Will the CAD 10 to 15 million in annual cost savings from network optimization initiatives be sufficient to offset potential future increases in fuel and environmental compliance costs?
 19
19







 Access 50+ Readymade Screeners
  Use 200+ Custom Filters
  Get Full Market Insights





