Spunweb FY26 Net Profit Jumps 54.7% to ₹23.07 Crore


Spunweb Nonwoven Limited reported robust FY26 results with consolidated net profit rising 54.73% to ₹2,306.80 lakhs and revenue increasing 22.22% to ₹32,448.22 lakhs. EBITDA grew 39.80% to ₹55.98 crores with improved margins, supported by new production lines and a solar power plant. The recording of the post-earnings conference call held on May 16, 2026, is available on the company website.
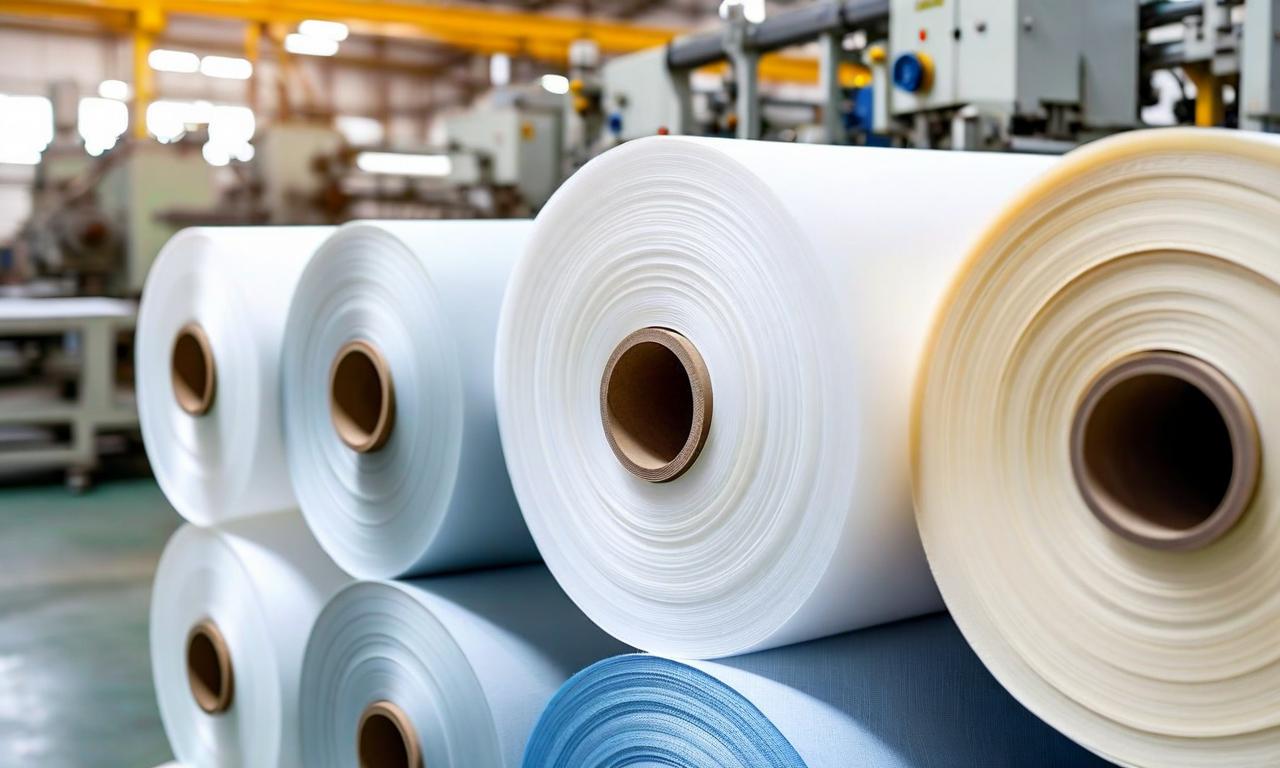

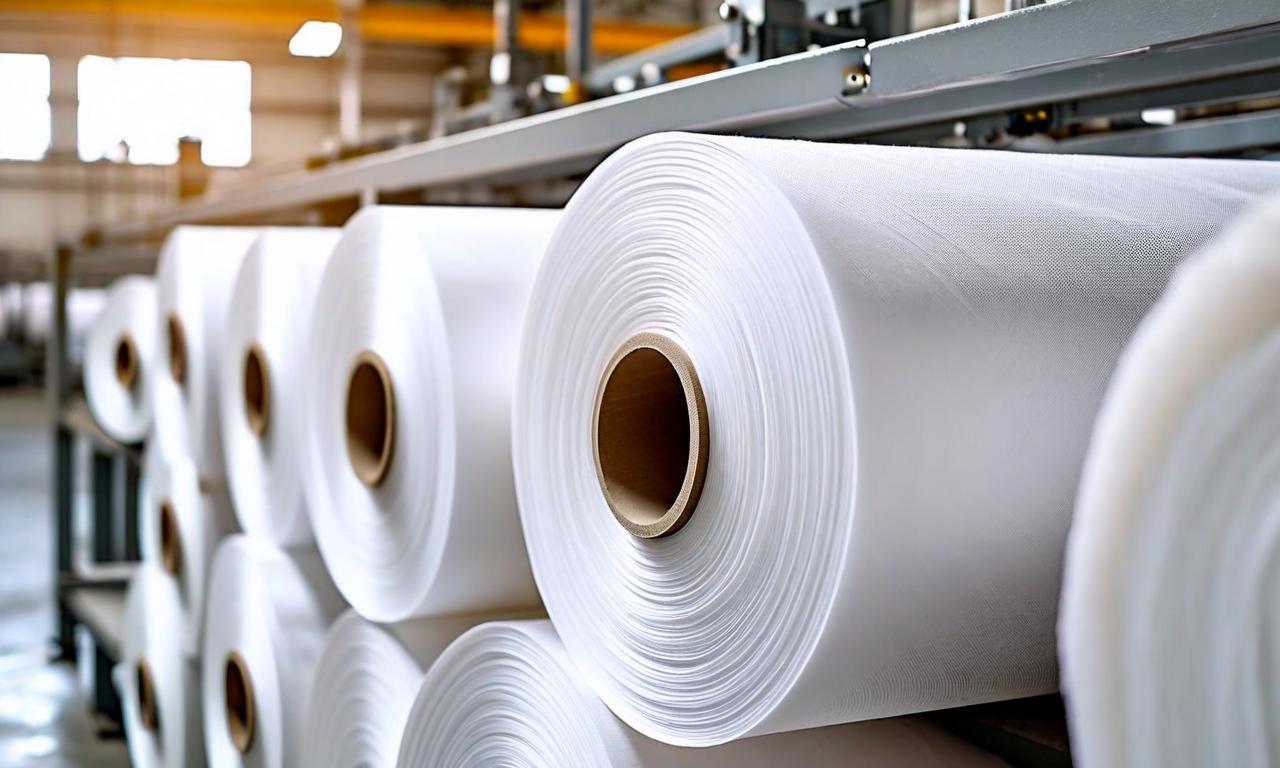
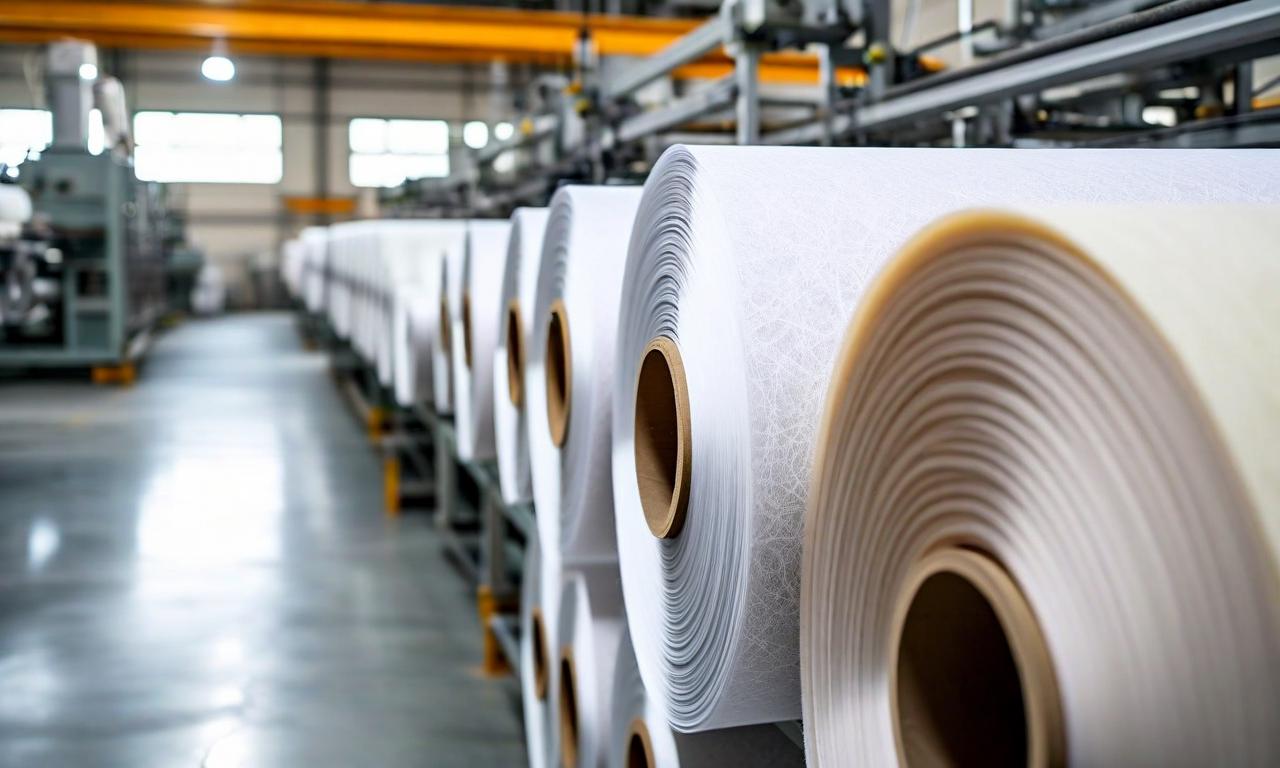
*this image is generated using AI for illustrative purposes only.
Spunweb Nonwoven Limited reported a strong financial performance for the year ended March 31, 2026, with significant growth in revenue and profitability on a consolidated basis. The company's Board of Directors approved the audited standalone and consolidated financial results on May 15, 2026. Following the results announcement, management held a post-earnings conference call on May 16, 2026, to discuss the business outlook and operational highlights. The recording of this conference call is now available on the company's website.
Consolidated Financial Performance
Spunweb Nonwoven delivered robust growth on a consolidated basis for FY26. Revenue from operations increased by 22.22% year-on-year to ₹32,448.22 lakhs, up from ₹22,559.06 lakhs in the previous year. Net profit more than doubled, rising by 54.73% to ₹2,306.80 lakhs compared to ₹1,079.22 lakhs in FY25. The company reported an EBITDA of ₹55.98 crores, an increase of 39.80%, with margins expanding by 149 basis points to 7.11%. Basic and Diluted EPS for the year stood at ₹10.37, up from ₹6.28 in the prior year.
The following table summarises the consolidated income statement highlights:
| Metric: | H2 FY26 (31-03-2026) | H1 FY26 (30-09-2025) | H2 FY25 (31-03-2025) | FY26 (Full Year) | FY25 (Full Year) |
|---|---|---|---|---|---|
| Revenue from Operations (₹ lakhs): | 18,808.25 | 13,639.97 | 12,350.38 | 32,448.22 | 22,559.06 |
| Other Income (₹ lakhs): | 179.69 | 24.93 | 28.81 | 204.62 | 74.23 |
| Total Income (₹ lakhs): | 18,987.94 | 13,664.90 | 12,379.19 | 32,652.84 | 22,633.28 |
| Total Expenses (₹ lakhs): | 17,115.98 | 12,162.30 | 11,316.48 | 29,278.28 | 21,058.65 |
| Profit Before Tax (₹ lakhs): | 1,871.96 | 1,502.60 | 1,062.71 | 3,374.56 | 1,574.63 |
| Net Profit (₹ lakhs): | 1,232.92 | 1,073.88 | 735.05 | 2,306.80 | 1,079.22 |
| Basic EPS (₹): | 5.12 | 5.25 | 4.25 | 10.37 | 6.28 |
| Diluted EPS (₹): | 5.12 | 5.25 | 4.25 | 10.37 | 6.28 |
Total expenses for FY26 amounted to ₹29,278.28 lakhs. Key components included cost of materials consumed at ₹23,244.12 lakhs, finance costs of ₹1,149.46 lakhs, and depreciation and amortisation of ₹1,278.90 lakhs.
Standalone Financial Performance
On a standalone basis, the company recorded revenue from operations of ₹24,321.08 lakhs for FY26, compared to ₹20,882.88 lakhs in FY25. Net profit for the year grew to ₹1,593.09 lakhs from ₹880.66 lakhs in the previous year. Basic and Diluted EPS increased to ₹7.16 from ₹5.12.
Operational Highlights and Outlook
During the post-earnings conference call, management highlighted that the hygiene sector remained the largest vertical, contributing over 50% of the revenue, followed by packaging and medical applications. The company commissioned a 3.2-meter single S line and a 1.6-meter single S production line during the year, which are expected to contribute approximately ₹80 to ₹85 crores in revenue annually. Additionally, a 6.5 MW ground-mounted solar power plant was commissioned to reduce long-term power costs.
Management stated that the new lines are dedicated to the packaging sector, which offers medium margins, while the hygiene sector provides higher margins. The company aims to reach 80-85% capacity utilization for the new lines within one to one and a half years. Regarding raw material costs, management noted that volatility in polypropylene prices is passed directly to customers, mitigating margin impact.
Balance Sheet and Cash Flow
The consolidated balance sheet as of March 31, 2026, shows total assets of ₹25,414.43 lakhs, up from ₹18,258.17 lakhs in the previous year. Shareholders' funds rose to ₹12,310.19 lakhs from ₹4,504.94 lakhs. Long-term borrowings decreased to ₹2,848.08 lakhs from ₹3,684.46 lakhs. On a standalone basis, total assets stood at ₹18,430.45 lakhs, with shareholders' funds rising to ₹11,485.75 lakhs.
On a consolidated basis, net cash generated from operating activities was ₹285.11 lakhs. Financing activities generated net cash of ₹3,044.04 lakhs, supported by proceeds from the issue of share capital amounting to ₹5,578.00 lakhs.
Historical Stock Returns for Spunweb Nonwoven
| 1 Day | 5 Days | 1 Month | 6 Months | 1 Year | 5 Years |
|---|---|---|---|---|---|
| 0.0% | -6.37% | -9.77% | -8.94% | -33.46% | -37.40% |
How quickly can Spunweb Nonwoven scale its new packaging-dedicated production lines to full capacity, and will the medium-margin packaging sector dilute overall EBITDA margins as its revenue contribution grows?
Given the significant gap between consolidated and standalone net profit, which subsidiaries are driving the incremental revenue, and are there plans for further inorganic expansion or acquisitions?
With polypropylene price volatility being passed directly to customers, how sustainable is this pricing arrangement if competition intensifies or key customers push back on pass-through mechanisms?
 18
18