

Sicagen India FY26 Results: Net profit falls 11%, revenue drops to ₹5,282 crore


- Standalone net profit fell 11% YoY to ₹129.1 crore for FY26
- Total revenue declined 3.3% to ₹5,282.2 crore amid higher costs
- Board recommends 10% dividend, totaling ₹39.6 crore payout
- Specialty Chemicals division revenue surged 38% to ₹153.1 crore
- Consolidated net profit rose 6% to ₹180.7 crore


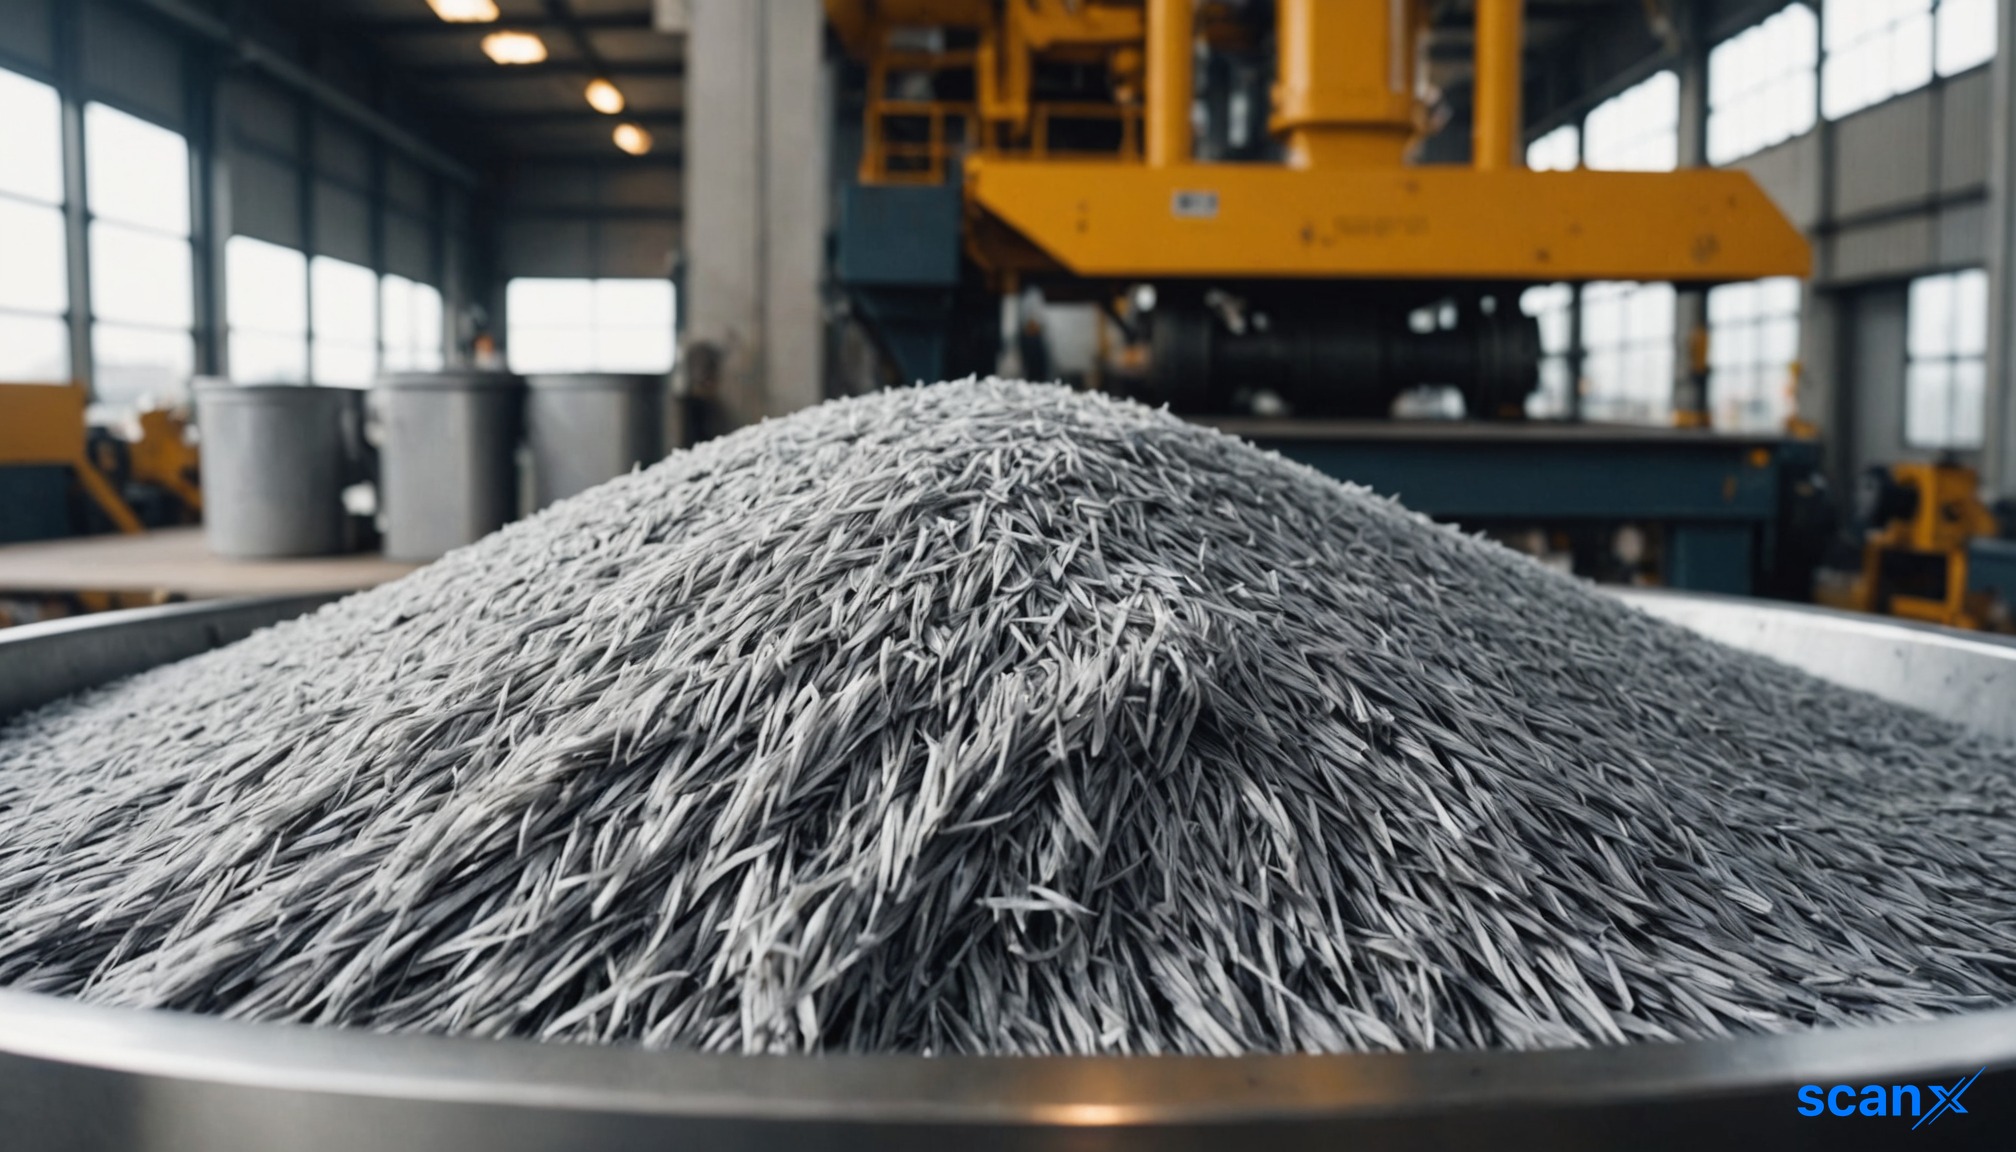
*this image is generated using AI for illustrative purposes only.
Sicagen India Limited reported a decline in its standalone net profit for the financial year ended March 31, 2026 (FY26), posting a profit after tax of ₹129.1 crore, down from ₹145.3 crore in the previous year. The company's total revenue stood at ₹5,282.2 crore, compared to ₹5,460.3 crore in FY25.
The Board of Directors has recommended a final dividend of Re. 1/- per equity share, representing a 10% payout on the face value of the shares. The total dividend payout for the year amounts to approximately ₹39.6 crore.
Financial Performance
The company's revenue from operations decreased to ₹5,202.7 crore from ₹5,386.9 crore in FY25. Earnings before interest, tax, depreciation, and amortization (EBITDA) remained relatively stable at ₹288.9 crore, marginally down from ₹290.6 crore in the prior year. The EBITDA margin improved slightly to 5.55% from 5.39%.
Profit before tax (PBT) declined to ₹173.8 crore from ₹200.2 crore. This reduction was primarily attributed to an increase in raw material costs, rates, taxes, and other administrative expenditures, as noted in the Management Discussion and Analysis report.
| Metric | FY26 | FY25 | Change |
|---|---|---|---|
| Revenue from Operations | ₹5,202.7 crore | ₹5,386.9 crore | -3.4% |
| Total Revenue | ₹5,282.2 crore | ₹5,460.3 crore | -3.3% |
| EBITDA | ₹288.9 crore | ₹290.6 crore | -0.6% |
| Profit Before Tax | ₹173.8 crore | ₹200.2 crore | -13.2% |
| Net Profit After Tax | ₹129.1 crore | ₹145.3 crore | -11.1% |
Segment-wise Review
The Building Materials division, the largest contributor, reported a revenue of ₹3,992.8 crore, down from ₹4,374.4 crore in FY25. However, the division saw a significant improvement in profitability, with PBT rising by 34% to ₹27.1 crore from ₹20.2 crore, aided by cost control measures and improved contribution margins in Q4 due to steel price increases.
The Power & Control Systems division achieved a 6% increase in turnover to ₹512.6 crore, with PBT rising 5% to ₹101.2 crore. Conversely, the Industrial Packaging division faced challenges due to rising raw material costs, leading to a 7% decline in PBT to ₹60.8 crore, despite a slight revenue increase to ₹412.5 crore.
The Specialty Chemicals division showed strong growth, with revenue jumping 38% to ₹153.1 crore and PBT increasing 16% to ₹35.0 crore, driven by higher sales volumes.
What the Numbers Show
While top-line growth remained subdued, the company demonstrated resilience in maintaining its operational efficiency. The divergence between the declining revenue in the Building Materials segment and the sharp rise in its profitability indicates effective margin management and cost optimization strategies implemented during the fiscal year. Additionally, the robust performance of the Specialty Chemicals division highlights successful volume expansion in niche markets.
Consolidated Results
On a consolidated basis, including subsidiaries, the group recorded a revenue from operations of ₹9,734.8 crore, up from ₹8,914.1 crore in FY25. The consolidated profit before tax remained flat at ₹252.5 crore, while the consolidated net profit after tax rose to ₹180.7 crore from ₹171.1 crore.
Historical Stock Returns for Sicagen
| 1 Day | 5 Days | 1 Month | 6 Months | 1 Year | 5 Years |
|---|---|---|---|---|---|
| +0.48% | -6.56% | -10.44% | -3.46% | -3.46% | -3.46% |

How will the sustained rise in raw material costs impact Sicagen India's pricing power and margin sustainability in the Industrial Packaging segment for FY27?
Can the Specialty Chemicals division maintain its 38% revenue growth trajectory, and what specific market drivers are fueling this niche expansion?
Given the divergence between standalone profit decline and consolidated profit growth, what strategic role are subsidiaries playing in offsetting core business headwinds?
 19
19




 Create Custom Screeners
  Access 200+ Pre-built Filters
  Use 50+ Readymade Screener





