

Shoe Station cuts FY26 adj EPS guidance to $0.75-$0.90, missing $1.48 estimate


- Shoe Station Group lowers FY26 adjusted EPS guidance to $0.75-$0.90, missing the $1.48 analyst estimate
- Full-year sales outlook reduced to $1.100 billion-$1.111 billion, below the $1.127 billion market expectation
- Q2FY26 net sales fell 7.2% YoY to $284.3 million amid promotional pressure
- Gross profit margin contracted 690 bps to 31.9% due to inventory liquidation
- Company remains debt-free with $131.6 million in cash and equivalents

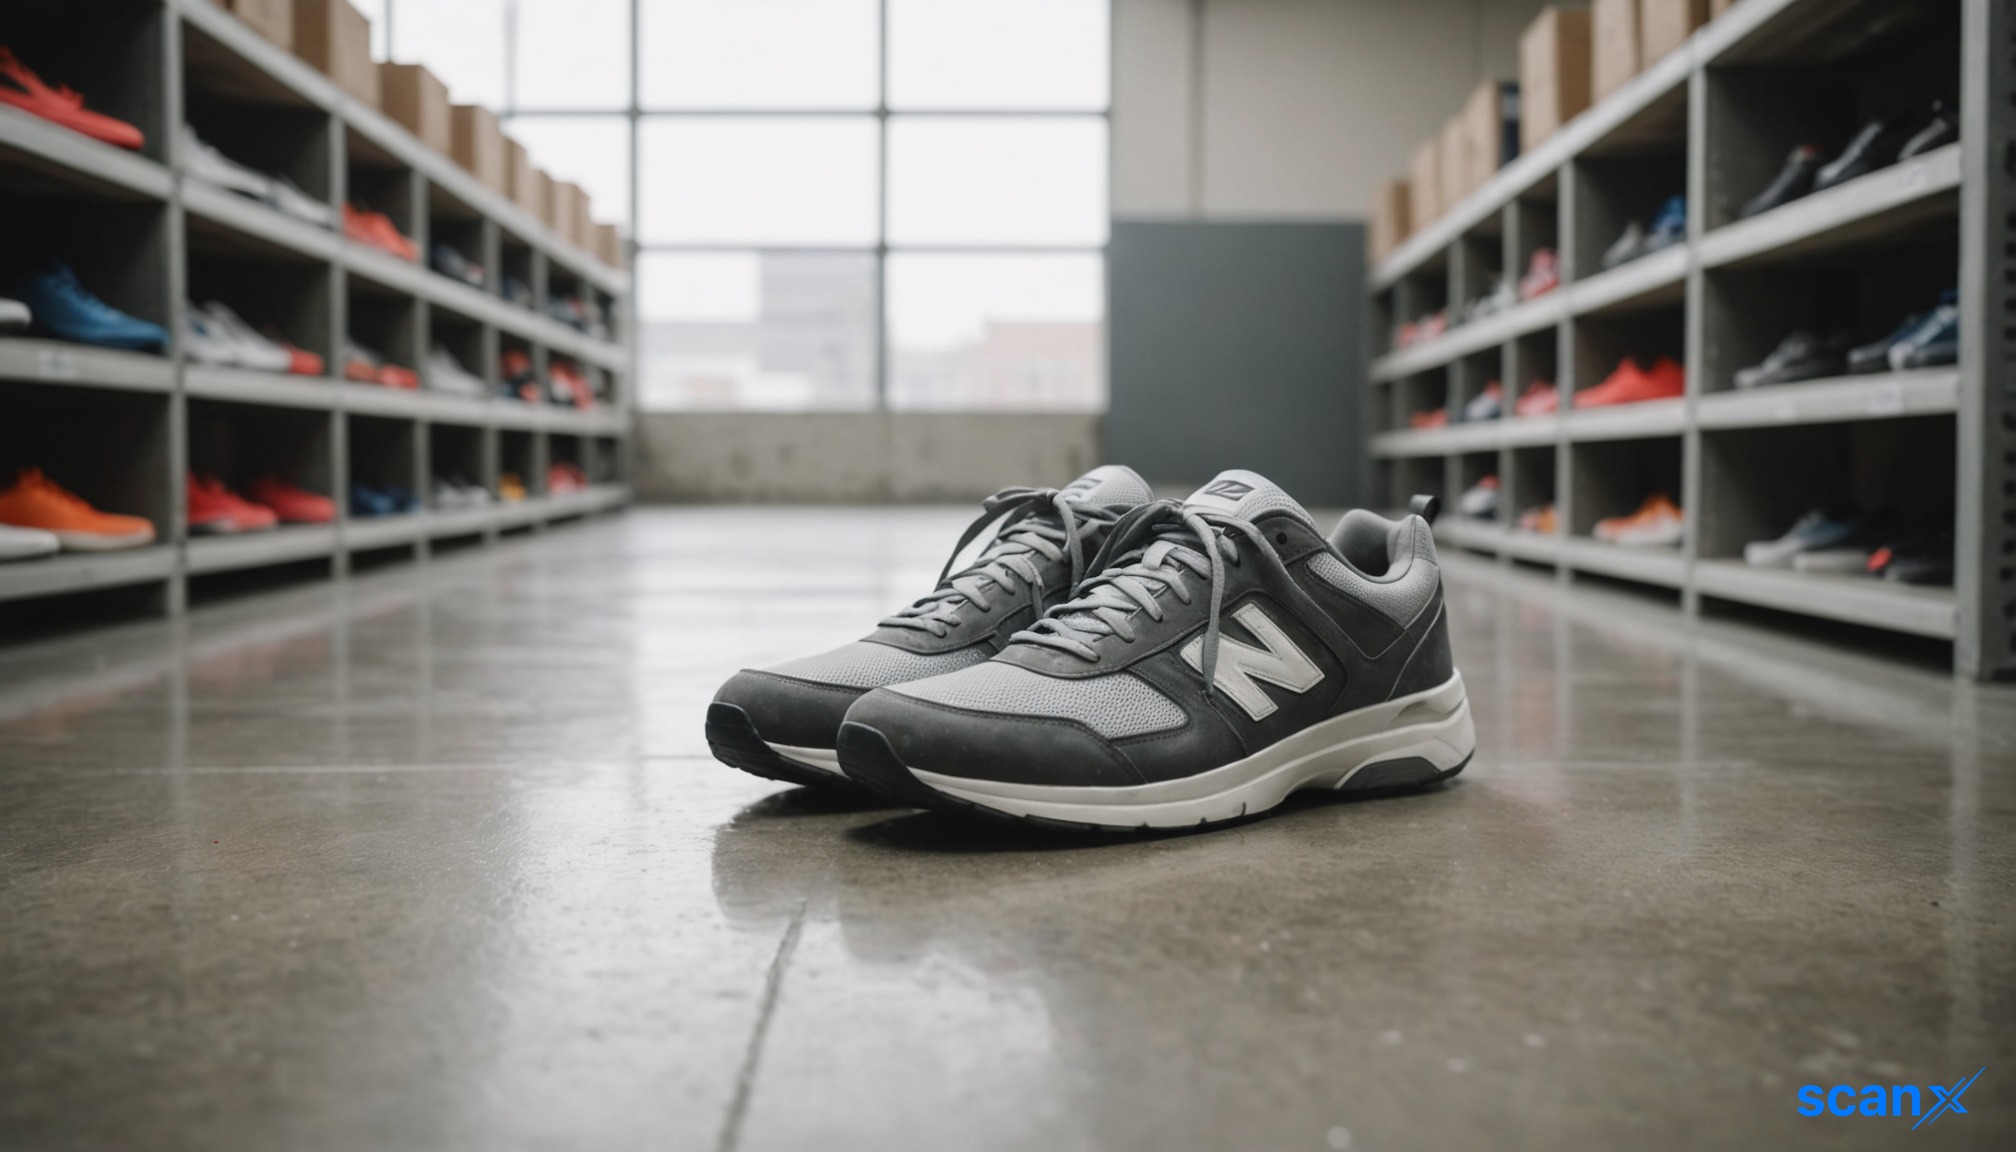

*this image is generated using AI for illustrative purposes only.
Shoe Station Group (NASDAQ: SHOE) lowered its fiscal 2026 adjusted earnings per share (EPS) guidance to $0.75–$0.90, significantly missing the $1.48 analyst estimate. The retailer also reduced its full-year sales outlook to $1.100 billion–$1.111 billion, falling short of the $1.127 billion market expectation.
The downward revision follows a second quarter ended August 1, 2026, in which net sales declined 7.2% year-on-year to $284.3 million. The company attributed the contraction to an increasingly promotional footwear marketplace and assortments that were not fully aligned with customer preferences.
Gross profit margin contracted sharply by 690 basis points to 31.9%, down from 38.8% in the prior-year period. This compression reflects increased promotional activity and the liquidation of aged inventory, alongside the absence of a temporary pricing benefit recorded in the previous year ahead of tariff-related cost increases.
Operational Performance
Comparable store sales declined 7.1% for the quarter. The decline was observed across both banners:
- Shoe Carnival: Net sales fell 6.5% to $178.5 million, representing 63% of total revenue.
- Shoe Station: Net sales dropped 8.4% to $105.7 million, accounting for the remaining 37%.
Selling, general and administrative (SG&A) expenses decreased $10.6 million to $83.0 million, improving as a percentage of net sales to 29.2% from 30.6% in the prior year. The reduction was driven by lower advertising costs and performance-based compensation.
Back-to-School Update
The company noted a significant improvement in trends during fiscal August. Comparable store sales declined by low single digits during the four weeks ended August 29, 2026, compared to the 7.1% decline seen in the broader second quarter. Management credited improved, localized athletic footwear assortments for this stabilization.
Balance Sheet and Cash Flow
Shoe Station Group ended the quarter debt-free with cash, cash equivalents, and marketable securities totaling $131.6 million, an increase of $39.7 million from the same period last year. Operating cash flow for the first half of FY26 stood at $34.1 million, despite a net income loss on a GAAP basis for the year-to-date period due to non-recurring charges.
What the Numbers Show
A significant divergence exists between reported GAAP profitability and underlying operational cash generation. While year-to-date net income was minimal at $0.6 million due to $13.6 million in non-recurring CEO transition and strategic review charges, adjusted net income remained robust at $12.5 million. Furthermore, operating cash flow of $34.1 million substantially exceeded net income, indicating strong working capital management through inventory reduction ($13.0 million cash inflow) despite the sales headwinds.
Fiscal 2026 Guidance
The company lowered its full-year guidance to reflect current industry trends:
| Metric | Guidance Range | Analyst Estimate |
|---|---|---|
| Net Sales | $1.100 billion – $1.111 billion | $1.127 billion |
| Gross Profit Margin | ~32.5% – ~32.7% | N/A |
| Adjusted EPS | $0.75 – $0.90 | $1.48 |
| GAAP EPS | $0.32 – $0.47 | N/A |
Interim CEO Cliff Sifford stated that the promotional environment is expected to persist through the balance of the year. The company plans to support the fall season with incremental advertising investment while maintaining its debt-free position.

How will the planned incremental advertising investment for the fall season impact Shoe Station Group's SG&A expense ratio and overall profitability in the second half of FY26?
Given the persistent promotional environment, what specific strategic adjustments is management making to align footwear assortments with customer preferences to halt the decline in comparable store sales?
Will the company's debt-free status and $131.6 million cash position enable potential M&A activity or store closures to optimize its footprint amid shrinking market demand?
 15
15







 Create Custom Screeners
  Access 200+ Pre-built Filters
  Use 50+ Readymade Screener





