

Seamec revenue up 37% in Q1FY27 to ₹3,169 crore; profit rises 7%


Seamec Ltd posted a 37% YoY rise in consolidated revenue to ₹3,169 crore in Q1FY27. Net profit grew 7% to ₹813 crore. Standalone revenue was ₹3,024 crore, up 36%. Pre-tax profit growth outpaced post-tax growth, indicating potential tax headwinds.


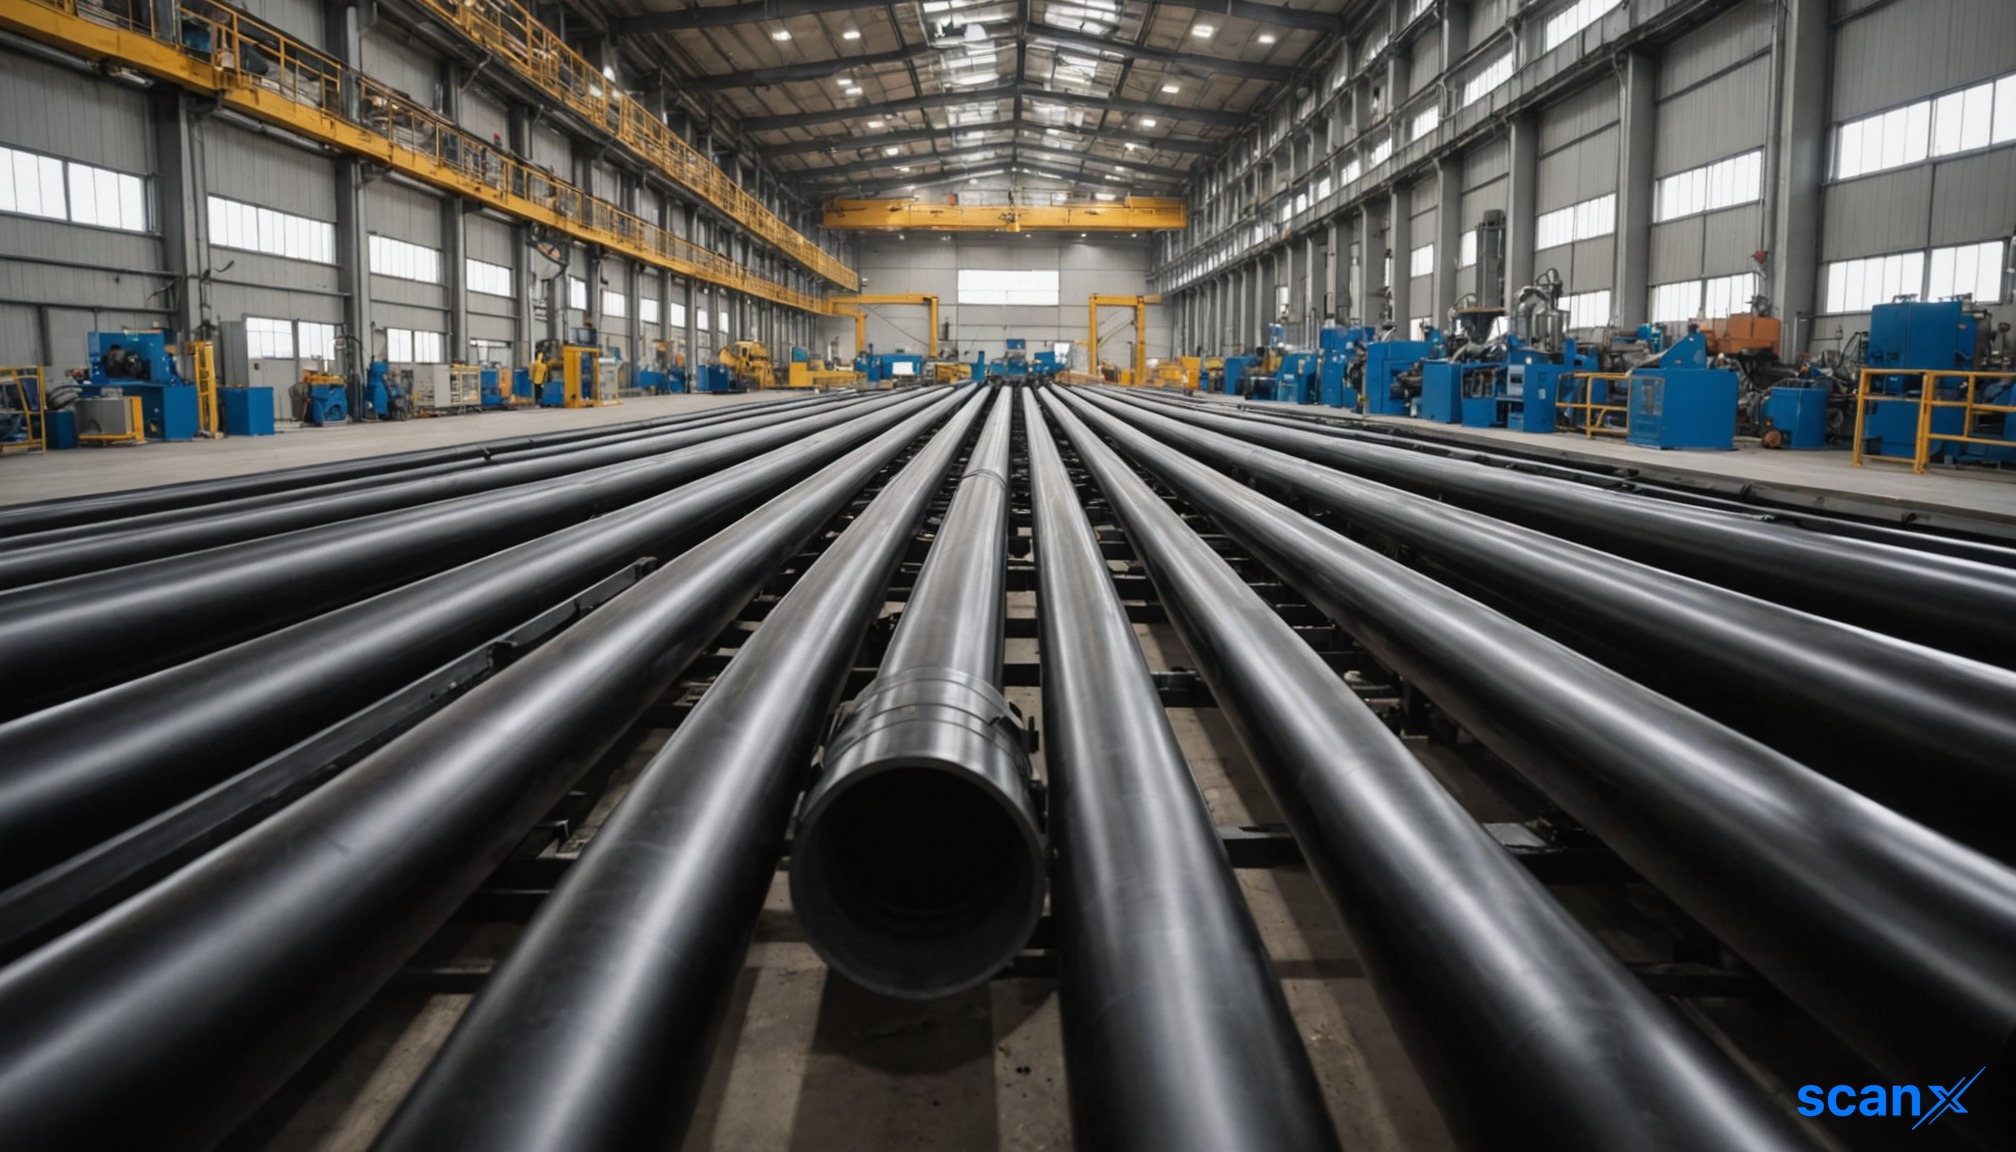
*this image is generated using AI for illustrative purposes only.
Seamec reported strong top-line growth in its first quarter of FY27, with consolidated revenue rising 37% year-on-year to ₹3,169 crore. Consolidated net profit after tax increased 7% to ₹813 crore, compared to ₹758 crore in the same period last year. The company’s standalone revenue grew 36% to ₹3,024 crore, while standalone net profit rose 2% to ₹812 crore.
The results, approved by the Board of Directors on August 13, 2026, highlight continued momentum in the marine engineering sector. While the existing article noted an EBITDA margin contraction in the prior reporting cycle, the new filing does not disclose EBITDA figures for this period. Instead, the focus remains on the robust revenue expansion and steady profitability across both standalone and consolidated bases.
Financial Highlights
| Metric: | Consolidated Q1FY27 | Consolidated Q1FY26 | Change | Standalone Q1FY27 | Standalone Q1FY26 | Change |
|---|---|---|---|---|---|---|
| Revenue: | ₹3,169 crore | ₹2,307 crore | +37% | ₹3,024 crore | ₹2,229 crore | +36% |
| Net Profit (Pre-tax): | ₹895 crore | ₹791 crore | +13% | ₹893 crore | ₹829 crore | +8% |
| Net Profit (Post-tax): | ₹813 crore | ₹758 crore | +7% | ₹812 crore | ₹796 crore | +2% |
What the Numbers Show
The divergence between pre-tax and post-tax profit growth suggests a higher effective tax rate or increased tax provisions in the current quarter. Pre-tax profits grew by 13% on a consolidated basis, while post-tax profits expanded by only 7%. This indicates that tax expenses may have absorbed a portion of the operating gains. Despite this, the absolute improvement in both revenue and net profit underscores the company’s ability to scale operations effectively.
The results were reviewed by the Audit Committee and approved by the Board of Directors at their meeting held on August 13, 2026. The financial statements have been prepared in accordance with Indian Accounting Standards (Ind AS) as prescribed under Section 133 of the Companies Act, 2013.
Historical Stock Returns for Seamec
| 1 Day | 5 Days | 1 Month | 6 Months | 1 Year | 5 Years |
|---|---|---|---|---|---|
| -1.05% | -8.80% | -6.01% | +9.37% | +72.73% | +33.39% |

What specific operational or market factors contributed to the divergence between the 13% pre-tax profit growth and the 7% post-tax profit growth in Q1FY27?
Given the absence of disclosed EBITDA figures, will management provide guidance on margin trends and cost pressures for the remainder of FY27?
How does Seamec plan to sustain its 37% revenue growth trajectory amidst potential fluctuations in global marine engineering demand?





 Access Market Heat-map & Insights
  Create, Save & Share your Screener
  Use 200+ Screening Filters





