

Sarda Energy & Minerals files FY26 sustainability report


- Sarda Energy & Minerals filed its FY26 BRSR report covering standalone operations
- Total energy consumption rose to 8,89,43,715.01 GJ from 3,74,03,829.14 GJ in FY25
- Scope 1 and 2 greenhouse gas emissions totaled 85,04,962.62 tCO₂e
- Total waste generated increased to 85,11,812.36 metric tonnes
- Two worker fatalities were reported in FY26, compared to zero in the prior year



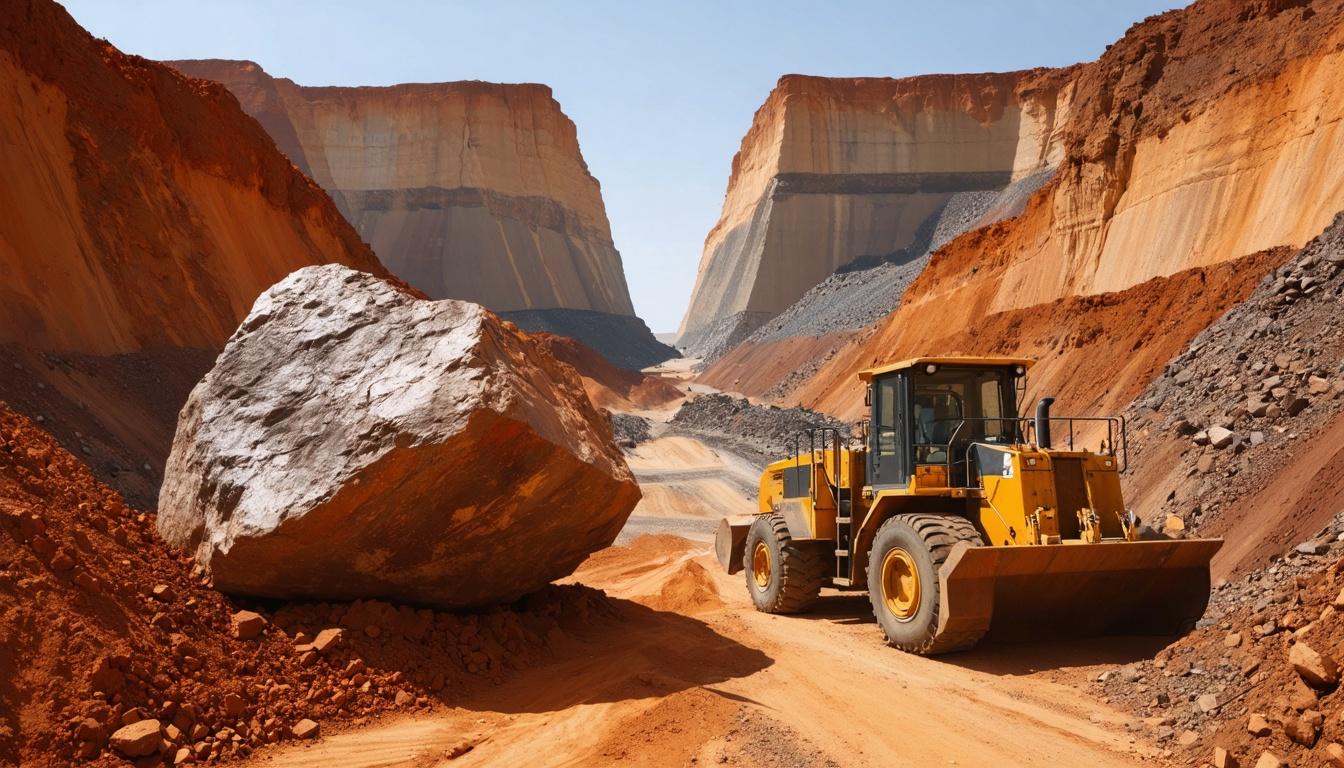
*this image is generated using AI for illustrative purposes only.
Sarda Energy & Minerals filed its Business Responsibility and Sustainability Report (BRSR) for FY26 with stock exchanges on August 31, 2026. The disclosure covers standalone operations across five facilities in Chhattisgarh, detailing environmental performance, safety metrics, and waste management practices.
Environmental Performance
The company reported total energy consumption of 8,89,43,715.01 GJ in FY26, up from 3,74,03,829.14 GJ in the prior year. Renewable energy sources contributed 439.01 GJ, while non-renewable sources accounted for 8,89,43,276 GJ. Greenhouse gas emissions (Scope 1 and Scope 2) totaled 85,04,962.62 tCO₂e, compared to 16,39,455.68 tCO₂e in FY25.
| Metric | FY26 | FY25 |
|---|---|---|
| Total Energy Consumption (GJ) | 8,89,43,715.01 | 3,74,03,829.14 |
| Scope 1 Emissions (tCO₂e) | 84,78,540.95 | 16,17,121.47 |
| Scope 2 Emissions (tCO₂e) | 26,421.67 | 22,334.21 |
Water withdrawal increased to 1,40,43,760.10 kilolitres from 86,09,687.28 kilolitres in FY25. The company maintains Zero Liquid Discharge (ZLD) practices across all plants, treating wastewater for recycling or horticultural use.
Waste Management
Total waste generated rose to 85,11,812.36 metric tonnes from 15,50,632.1 metric tonnes in the previous year. Non-hazardous waste constituted the majority of this volume. The company recovered 1,91,880.38 metric tonnes through recycling and reuse operations.
Safety and Governance
The report disclosed two fatalities among workers in FY26, compared to none in FY25. The Lost Time Injury Frequency Rate (LTIFR) for workers was 0.85 per million person-hours worked. No injuries or fatalities were reported among employees. Moore Singhi Advisors LLP provided reasonable assurance on the core KPIs.
What the Numbers Show
The significant increase in total energy consumption and GHG emissions aligns with the expanded reporting boundary, which now includes all manufacturing locations and mining operations. This broader scope explains the higher absolute figures compared to the restated prior year data.
Historical Stock Returns for Sarda Energy & Minerals
| 1 Day | 5 Days | 1 Month | 6 Months | 1 Year | 5 Years |
|---|---|---|---|---|---|
| -2.19% | -2.75% | -7.44% | -11.15% | -14.33% | +522.20% |

How does Sarda Energy's current renewable energy contribution of 439.01 GJ compare to its stated long-term decarbonization targets for FY27 and beyond?
What specific capital expenditure plans has the company outlined to reduce the disproportionate rise in Scope 1 emissions relative to production growth?
Given the two worker fatalities in FY26, what corrective safety protocols or governance changes are being implemented to prevent recurrence and improve the LTIFR?
 20
20











 Access 50+ Readymade Screeners
  Use 200+ Custom Filters
  Get Full Market Insights





