

Safe Bulkers Q2FY26 Results: Adjusted EBITDA doubles to $50.3 million


- Adjusted EBITDA doubled to $50.3 million in Q2 2026 from $25.5 million in Q2 2025
- Adjusted EPS rose to $0.28 from $0.01 year-on-year
- Quarterly dividend increased to 7.5 cents per share for the second consecutive quarter
- Leverage ratio remains at 30% with total liquidity of $343 million
- Average time charter equivalent rates jumped 39% to $20,642 despite a smaller active fleet

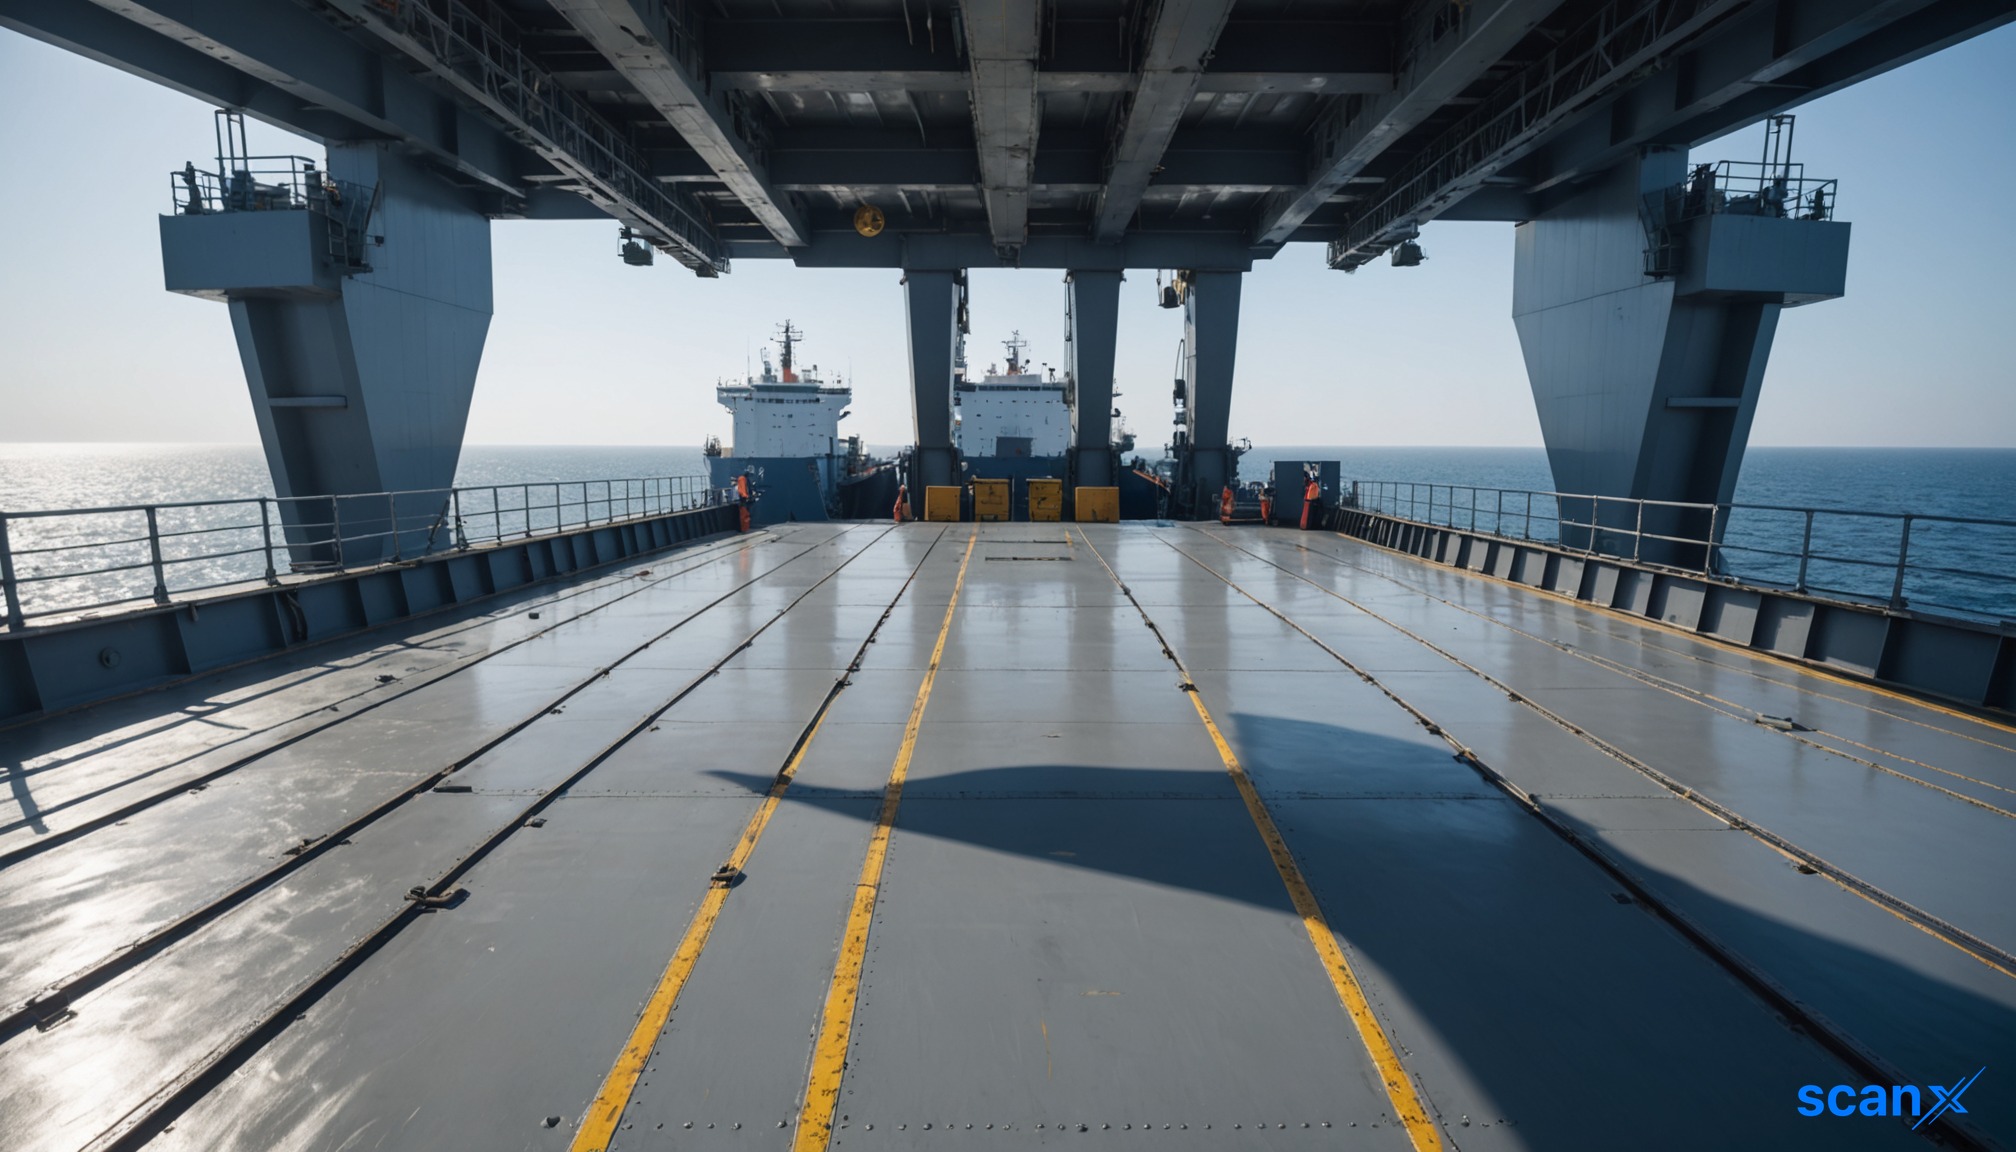

*this image is generated using AI for illustrative purposes only.
Safe Bulkers (NYSE: SB) reported a sharp improvement in second-quarter 2026 financials, driven by higher charter hires and earnings from scrubber-fitted vessels. The company posted an adjusted EBITDA of $50.3 million, up from $25.5 million in Q2 2025.
Management highlighted that the strong charter market supported these results, allowing the firm to increase its quarterly dividend to 7.5 cents per share for the second consecutive quarter. This marks the 19th consecutive quarterly dividend payment.
Financial Performance
The company’s adjusted earnings per share (EPS) rose significantly to $0.28 in Q2 2026, compared to $0.01 in the same period last year. This calculation is based on a weighted average of 101.8 million shares, down slightly from 102.5 million shares in Q2 2025.
Revenue generation remained robust, with total revenues reaching $169 million for the first half of 2026. Operational efficiency also improved, as daily vessel operating expenses decreased by 6% to $6,207 in Q2 2026, compared to $6,607 in Q2 2025. Daily running expenses, excluding drydocking and pre-delivery costs, fell by 3% to $5,455.
| Metric | Q2 2026 | Q2 2025 |
|---|---|---|
| Adjusted EBITDA | $50.3 million | $25.5 million |
| Adjusted EPS | $0.28 | $0.01 |
| Avg Time Charter Equivalent | $20,642 | $14,875 |
| Daily Operating Expenses | $6,207 | $6,607 |
Fleet and Market Dynamics
Safe Bulkers operated an average of 45.13 vessels in Q2 2026, earning an average time charter equivalent rate of $20,642. This compares to 46.75 vessels averaging $14,875 in Q2 2025. The fleet’s average age stands at 10.3 years, approximately two years younger than the global fleet average of 12.5 years.
The company continues its fleet renewal strategy with 24 Phase 3 vessels on order since 2021, including two dual-fuel newbuilds scheduled for delivery in Q1 2027. Environmental upgrades have contributed to a 22% reduction in carbon emissions density across the fleet.
Balance Sheet and Liquidity
The company maintains a conservative leverage ratio of 30%. Total liquidity stands at $343 million, comprising $143 million in cash and cash equivalents, bank deposits, and fixed cash, alongside $200 million available under revolving credit facilities.
Total debt is approximately $519 million, including a €100 million unsecured bond with a fixed coupon of 2.95%. The weighted average interest rate on consolidated debt is 5.10%. Safe Bulkers holds a contracted revenue backlog of about $154 million, supporting its capital expenditure plans of $277 million.
What the Numbers Show
The doubling of adjusted EBITDA from $25.5 million to $50.3 million was primarily driven by a 39% increase in average time charter equivalent rates ($14,875 to $20,642), rather than fleet size. In fact, the average vessel count declined by 3.5% (from 46.75 to 45.13 vessels). This indicates that revenue growth was entirely rate-led, highlighting the sensitivity of margins to charter market conditions while operational costs per vessel decreased by 6%.

How sustainable are the current 39% higher time charter rates given global dry bulk supply and demand forecasts for the remainder of 2026?
What specific impact will the Q1 2027 delivery of dual-fuel newbuilds have on Safe Bulkers' competitive advantage against older, non-compliant vessels?
Could the company's conservative 30% leverage ratio provide an opportunity for strategic M&A activity in a consolidating shipping market?
 17
17









 Access 50+ Readymade Screeners
  Use 200+ Custom Filters
  Get Full Market Insights





