

Rhetan TMT submits FY26 sustainability report to exchanges


- Rhetan TMT filed its FY26 BRSR report on August 25, 2026
- Total energy consumption fell to 2,942.97 GJ from 4,480.35 GJ
- Turnover was ₹37.16 crore with net worth at ₹93.98 crore
- Related-party purchases rose to 64.30% of total buys
- Zero lost-time injuries recorded for employees and workers

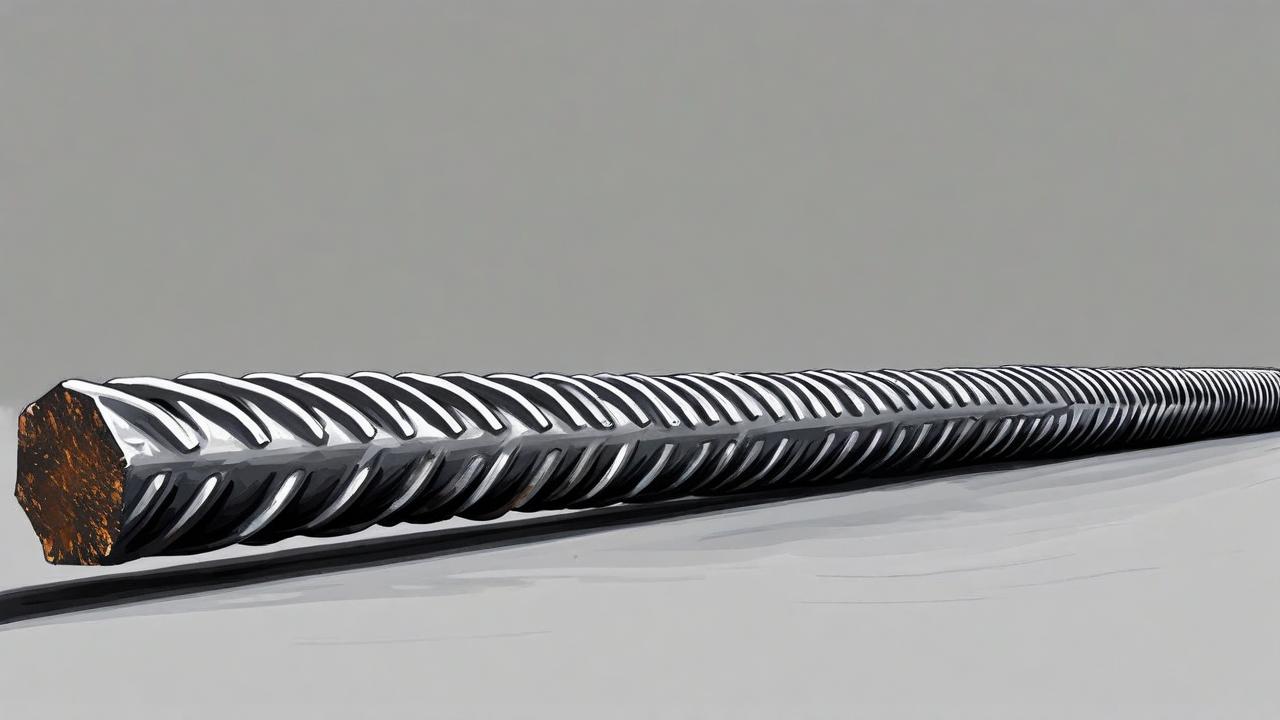

*this image is generated using AI for illustrative purposes only.
Rhetan TMT Limited submitted its Business Responsibility and Sustainability Report (BRSR) for FY26 to the Bombay Stock Exchange and National Stock Exchange on August 25, 2026.
The report covers the company's standalone operations, which are concentrated in the manufacturing of iron and steel products. The firm operates a single plant and office location within Gujarat, serving the domestic construction sector.
Operational Metrics
Rhetan TMT's turnover for FY26 stood at ₹37.16 crore, while its net worth was reported at ₹93.98 crore. The company did not incur any CSR obligations under Section 135 of the Companies Act, 2013 during the period.
Energy and Environmental Data
Total energy consumption decreased significantly year-on-year. The company consumed 2,942.97 GJ of energy in FY26, down from 4,480.35 GJ in FY25. This reduction was driven by lower electricity usage from non-renewable sources, which fell to 2,919.23 GJ from 4,400.63 GJ.
Water withdrawal remained stable at 695 kilolitres, sourced entirely from groundwater. The entity reported zero liquid discharge and no hazardous waste generation.
Workforce and Safety
The workforce consisted of 40 permanent employees and 37 non-permanent workers as of the end of FY26. Female representation among permanent employees was 7.32%, while the board included one female director out of six members.
The company recorded no lost-time injuries or fatalities for either employees or workers in FY26 or FY25. One health and safety grievance remained pending resolution at the close of the financial year.
What the Numbers Show
The divergence between rising related-party purchases and falling sales concentration warrants attention. Purchases from related parties jumped to 64.30% of total purchases in FY26, up sharply from 34.71% in FY25. Conversely, sales concentration among the top 10 dealers declined to 81.76% from 92.30%, suggesting a broadening of the distribution base despite deeper upstream integration.
Historical Stock Returns for Rhetan TMT
| 1 Day | 5 Days | 1 Month | 6 Months | 1 Year | 5 Years |
|---|---|---|---|---|---|
| -4.95% | -26.32% | -30.44% | -38.21% | -28.75% | -28.75% |

How might the sharp increase in related-party purchases to 64.30% impact Rhetan TMT's supply chain resilience and margin stability in FY27?
What specific operational strategies or technology upgrades contributed to the 34% reduction in non-renewable energy consumption, and are these measures scalable?
Given the reliance on groundwater for 100% of water withdrawal, what contingency plans does the company have to mitigate risks associated with local water scarcity regulations?
 19
19









 Create Custom Screeners
  Access 200+ Pre-built Filters
  Use 50+ Readymade Screener





