

PRO REIT Q2FY26 Results: Property revenue rises 7.7% YoY to $27 million


- Property revenue rose 7.7% YoY to $27 million, driven by lease renewals at positive spreads
- Completed $107.3 million in equity financing to support acquisitions and maintain liquidity
- Acquired 17 industrial properties in Quebec City and Winnipeg for $136.8 million
- Same-property NOI grew 3.3% YoY despite two vacancies reducing overall occupancy to 95%
- Total debt increased to $609.2 million, though debt-to-assets ratio fell to 47.4%

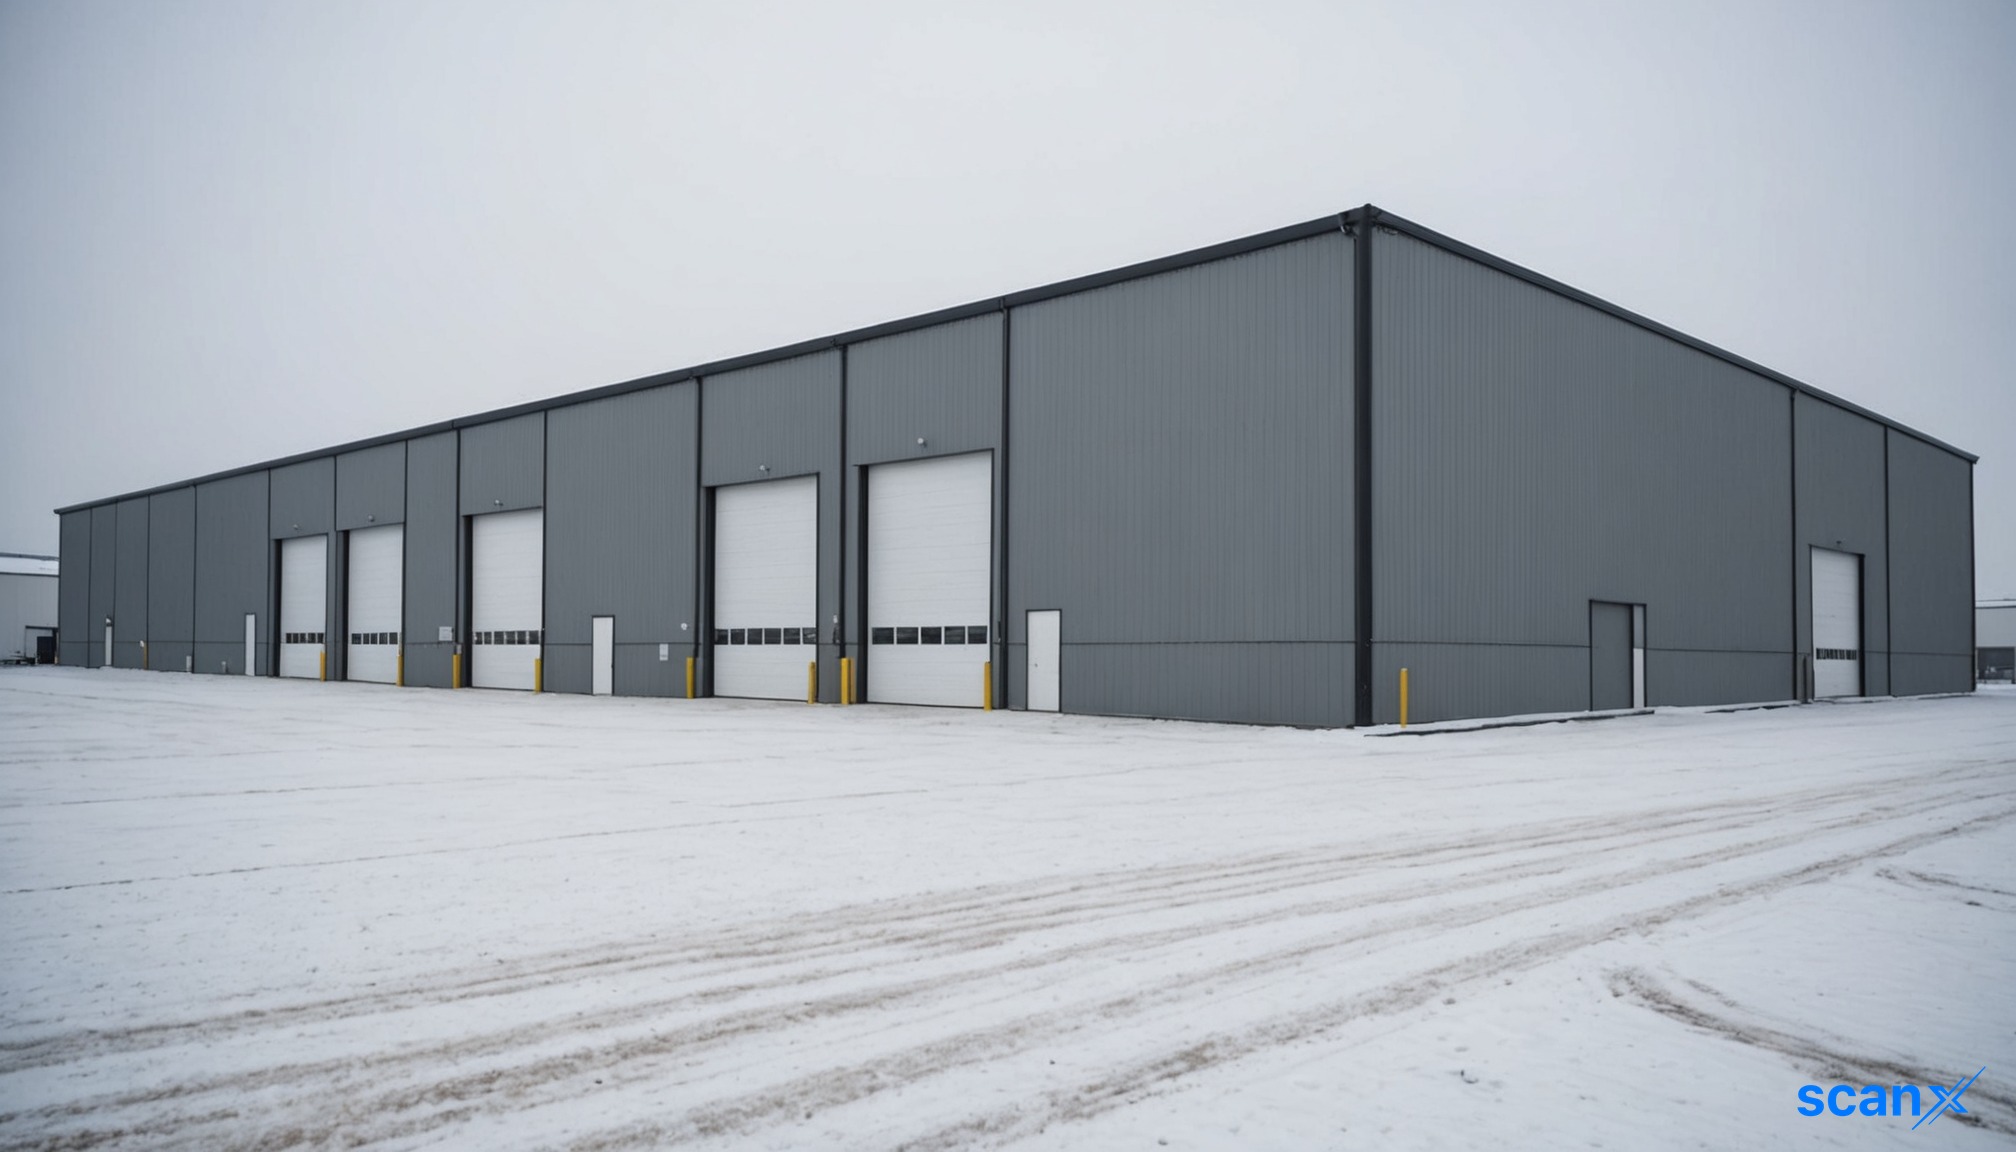

*this image is generated using AI for illustrative purposes only.
PRO REIT (TSX: PRV) reported a 7.7% year-over-year increase in property revenue to $27 million for the second quarter of fiscal 2026. The growth was driven by higher rental rates on lease renewals and new leases, alongside contributions from recently acquired properties.
The industrial-focused real estate investment trust also completed $107.3 million in equity financing during the quarter, including an $83.3 million bought deal offering and a $24 million private placement. This capital infusion supported the acquisition of 17 industrial properties in Quebec City and Winnipeg for $136.8 million, expanding its portfolio to 126 income-producing assets.
Financial Performance
Property revenue reached $27 million, up from $25.07 million in the same period last year. Net operating income (NOI) rose 6.5% year-over-year to $16.5 million, reflecting contractual rent escalations and stronger renewal rates. Same-property NOI, covering 97 of the company's 122 properties at June 30, increased 3.3% to $14.3 million despite two disclosed vacancies impacting overall occupancy.
Funds from operations (FFO) totaled $8.5 million, a 6.1% year-over-year increase. However, basic FFO per unit declined to approximately $0.12 from $0.13 a year ago, primarily due to the higher weighted average unit count following the equity financing. Adjusted funds from operations (AFFO) payout ratio stood at 98.9%, compared with 89.8% in the prior-year quarter.
| Metric | Q2FY26 | Q2FY25 | Change |
|---|---|---|---|
| Property Revenue | $27 million | $25.07 million | +7.7% |
| Net Operating Income | $16.5 million | $15.49 million | +6.5% |
| Same-Property NOI | $14.3 million | $13.84 million | +3.3% |
| FFO | $8.5 million | $8.01 million | +6.1% |
| Basic FFO Per Unit | $0.12 | $0.13 | -7.7% |
Leasing and Portfolio Activity
Leasing momentum remained robust, with 83% of 2026 lease maturities renewed at positive average spreads of 36.8%. Within the industrial portfolio specifically, 80.4% of maturities were renewed at an average positive spread of 40.6%. More than 400,000 square feet of space will begin generating higher rental rates in September, with full-quarter impact expected in Q4.
Overall portfolio occupancy was 95% at quarter end, down from 97.8% a year earlier. This decline was primarily driven by two vacancies: a 176,000-square-foot property in Saint-Vincent, Quebec, and an 81,000-square-foot property in Woodstock, Ontario. Management noted that excluding these vacancies, occupancy would have been approximately 97.4%.
Balance Sheet and Liquidity
Total debt rose to $609.2 million at June 30, up from $562.4 million a year earlier, reflecting new mortgage financing used to fund acquisitions. Total debt to total assets decreased to 47.4% from 50.6% in the prior year. Adjusted debt to annualized adjusted EBITDA increased slightly to 10.0 times from 9.8 times.
Net cash flows provided from operating activities were $10.6 million, a 54.3% year-over-year increase driven by timing differences in cash receipts and payable settlements. The distribution per unit was maintained at $0.0375 for the second quarter.
What the Numbers Show
The divergence between rising aggregate revenue (+7.7%) and declining per-unit FFO (-$0.01) highlights the immediate dilutive impact of the recent equity financing. While operational metrics improved through lease renewals at significant positive spreads (36.8%), the timing gap between raising capital ($107.3 million) and deploying it into acquisitions means per-unit earnings have temporarily compressed. This suggests that future per-unit growth will depend heavily on the accretion of newly acquired assets into the NOI base in the latter half of the fiscal year.

How long will it take for the newly acquired 17 industrial properties to become accretive to per-unit FFO, offsetting the current dilution from the $107.3 million equity raise?
What is management's specific strategy for leasing the two large vacant properties in Saint-Vincent and Woodstock, and what is the expected timeline for returning occupancy to pre-vacancy levels?
Given the adjusted debt-to-EBITDA ratio of 10.0x, does PRO REIT plan to refinance any existing debt or issue new equity to manage leverage as interest rates fluctuate?
 18
18






 Access 50+ Readymade Screeners
  Use 200+ Custom Filters
  Get Full Market Insights





