

Oil Country Tubular narrows net loss to Rs 13.64 crore in Q4FY26


Oil Country Tubular Limited reported a narrowed net loss of Rs 13.64 crore for Q4FY26, compared to Rs 10.54 crore in the prior year, with revenue from operations declining to Rs 298.56 crore. For the full fiscal year FY26, the net loss widened to Rs 61.48 crore on a total income of Rs 718.11 crore. The company converted OCPS into equity shares during the year, increasing its paid-up capital.


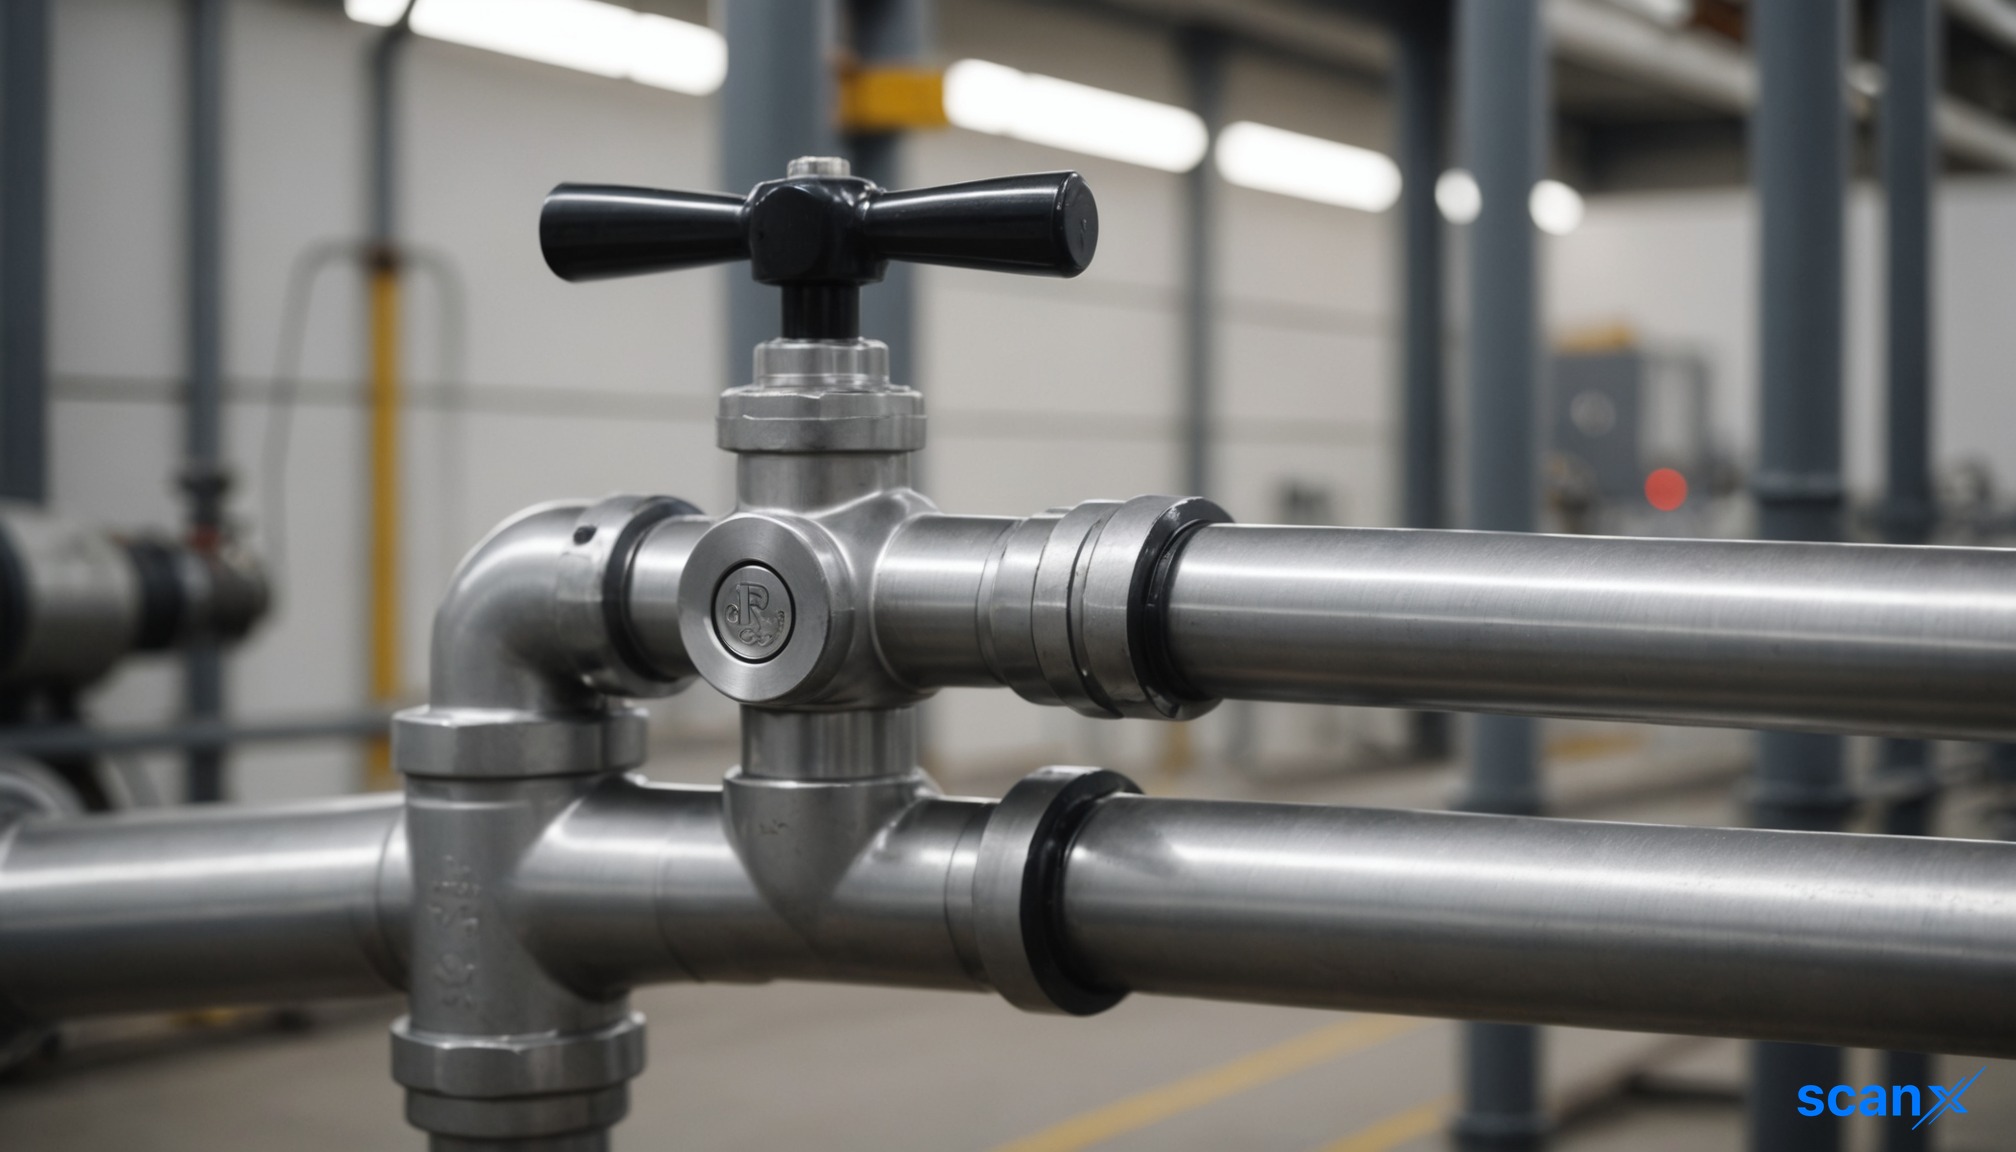
*this image is generated using AI for illustrative purposes only.
Oil Country Tubular Limited narrowed its net loss to Rs 13.64 crore for the quarter ended March 31, 2026, compared to a net loss of Rs 10.54 crore in the corresponding quarter of the previous year. The company reported revenue from operations of Rs 298.56 crore for Q4FY26, a decline from Rs 343.34 crore in Q4FY25. For the full fiscal year ended March 31, 2026, the company recorded a net loss of Rs 61.48 crore, widening from the previous year's loss of Rs 31.86 crore, with total income for the year standing at Rs 718.11 crore.
The Board of Directors took the results on record at its meeting held on May 21, 2026. Statutory auditors C K S Associates LLP conducted an audit review of the quarterly and annual financial results. In their report, the auditors stated that the results give a true and fair view in conformity with the recognition and measurement principles laid down in the applicable accounting standards.
Financial Performance
The company’s expenses for the quarter totaled Rs 454.87 crore, slightly lower than Rs 473.45 crore in the same quarter last year. Key expense components included depreciation and amortisation expenses of Rs 175.10 crore and employee benefits expenses of Rs 30.09 crore. For the year ended March 31, 2026, total expenses amounted to Rs 1,361.67 crore.
The Earnings Per Share (EPS) for the quarter was reported at (2.62) on a basic basis and (2.35) on a diluted basis. For the full year, the basic EPS stood at (12.01), while the diluted EPS was (10.58). The EBITDA for the year ended March 31, 2026, was Rs 630.32 lakhs.
Capital Structure and Segment Performance
During the year under review, the company issued and allotted 41,50,000 equity shares of face value of Rs 10 each fully paid up, pursuant to the conversion of Optionally Convertible Preference Shares (OCPS) to Equity Shares at a premium of Rs 55 each on May 8, 2025. Consequently, the paid-up equity share capital increased to Rs 519.90 crore as of March 31, 2026, from Rs 478.40 crore in the previous year.
Segment-wise revenue for the year was driven primarily by Drill Pipe and Allied Products, which contributed Rs 507.06 crore, while OCTG Services contributed Rs 193.88 crore. The Drill Pipe and Allied Products segment reported a loss before interest and tax of Rs 470.19 crore for the year, while the OCTG Services segment reported a loss of Rs 179.79 crore.
| Financial Metrics (Rs in Lakhs) | Q4FY26 | Q4FY25 | FY26 | FY25 |
|---|---|---|---|---|
| Revenue from Operations | 2,985.62 | 3,433.42 | 7,009.41 | 12,290.31 |
| Total Income | 3,041.09 | 3,539.16 | 7,181.12 | 12,576.76 |
| Total Expenses | 4,548.69 | 4,734.49 | 13,616.66 | 15,486.83 |
| Net Profit / (Loss) | (1,363.64) | (1,054.16) | (6,148.24) | (3,186.12) |
| Basic EPS | (2.62) | (2.35) | (12.01) | (7.10) |
Assets and Liabilities
The company’s total assets as of March 31, 2026, stood at Rs 3,137.70 crore, a decrease from Rs 3,820.10 crore in the previous year. Non-current assets, which include property, plant, and equipment, were valued at Rs 2,448.47 crore. Current assets decreased to Rs 689.22 crore from Rs 732.55 crore in the prior year.
On the liabilities side, total equity and liabilities stood at Rs 3,137.70 crore. Equity share capital increased to Rs 519.90 crore, while other equity decreased to Rs 1,454.31 crore. Non-current liabilities were reduced to Rs 975.85 crore from Rs 1,153.81 crore, and current liabilities decreased significantly to Rs 187.65 crore from Rs 352.08 crore.
Historical Stock Returns for Oil Country Tubular
| 1 Day | 5 Days | 1 Month | 6 Months | 1 Year | 5 Years |
|---|---|---|---|---|---|
| -1.31% | -6.58% | +26.60% | +64.93% | +12.06% | 0.0% |

What strategic initiatives will the company implement to reverse the widening annual net loss and declining revenue trends?
How will the reduction in non-current and current liabilities impact the company's liquidity position and future capital allocation plans?
Are there any anticipated operational improvements or cost-cutting measures to address the significant losses reported in the Drill Pipe and Allied Products segment?
 18
18






 Create Custom Screeners
  Access 200+ Pre-built Filters
  Use 50+ Readymade Screener





