Niu Technologies Q3FY26 Results: Total unit sales up 15% YoY to 537,457

scanx
Reviewed by
Ashish TScanX News Team
Key Highlights
  • Total unit sales rose 15.4% YoY to 537,457 in Q3FY26
  • China market sales increased 9% YoY to 490,406 units
  • International sales surged to 47,051 units from 14,418 units in Q3FY25
  • YTD FY26 sales volume reached 1,233,768 units
powered bylight_fuzz_icon
52733230

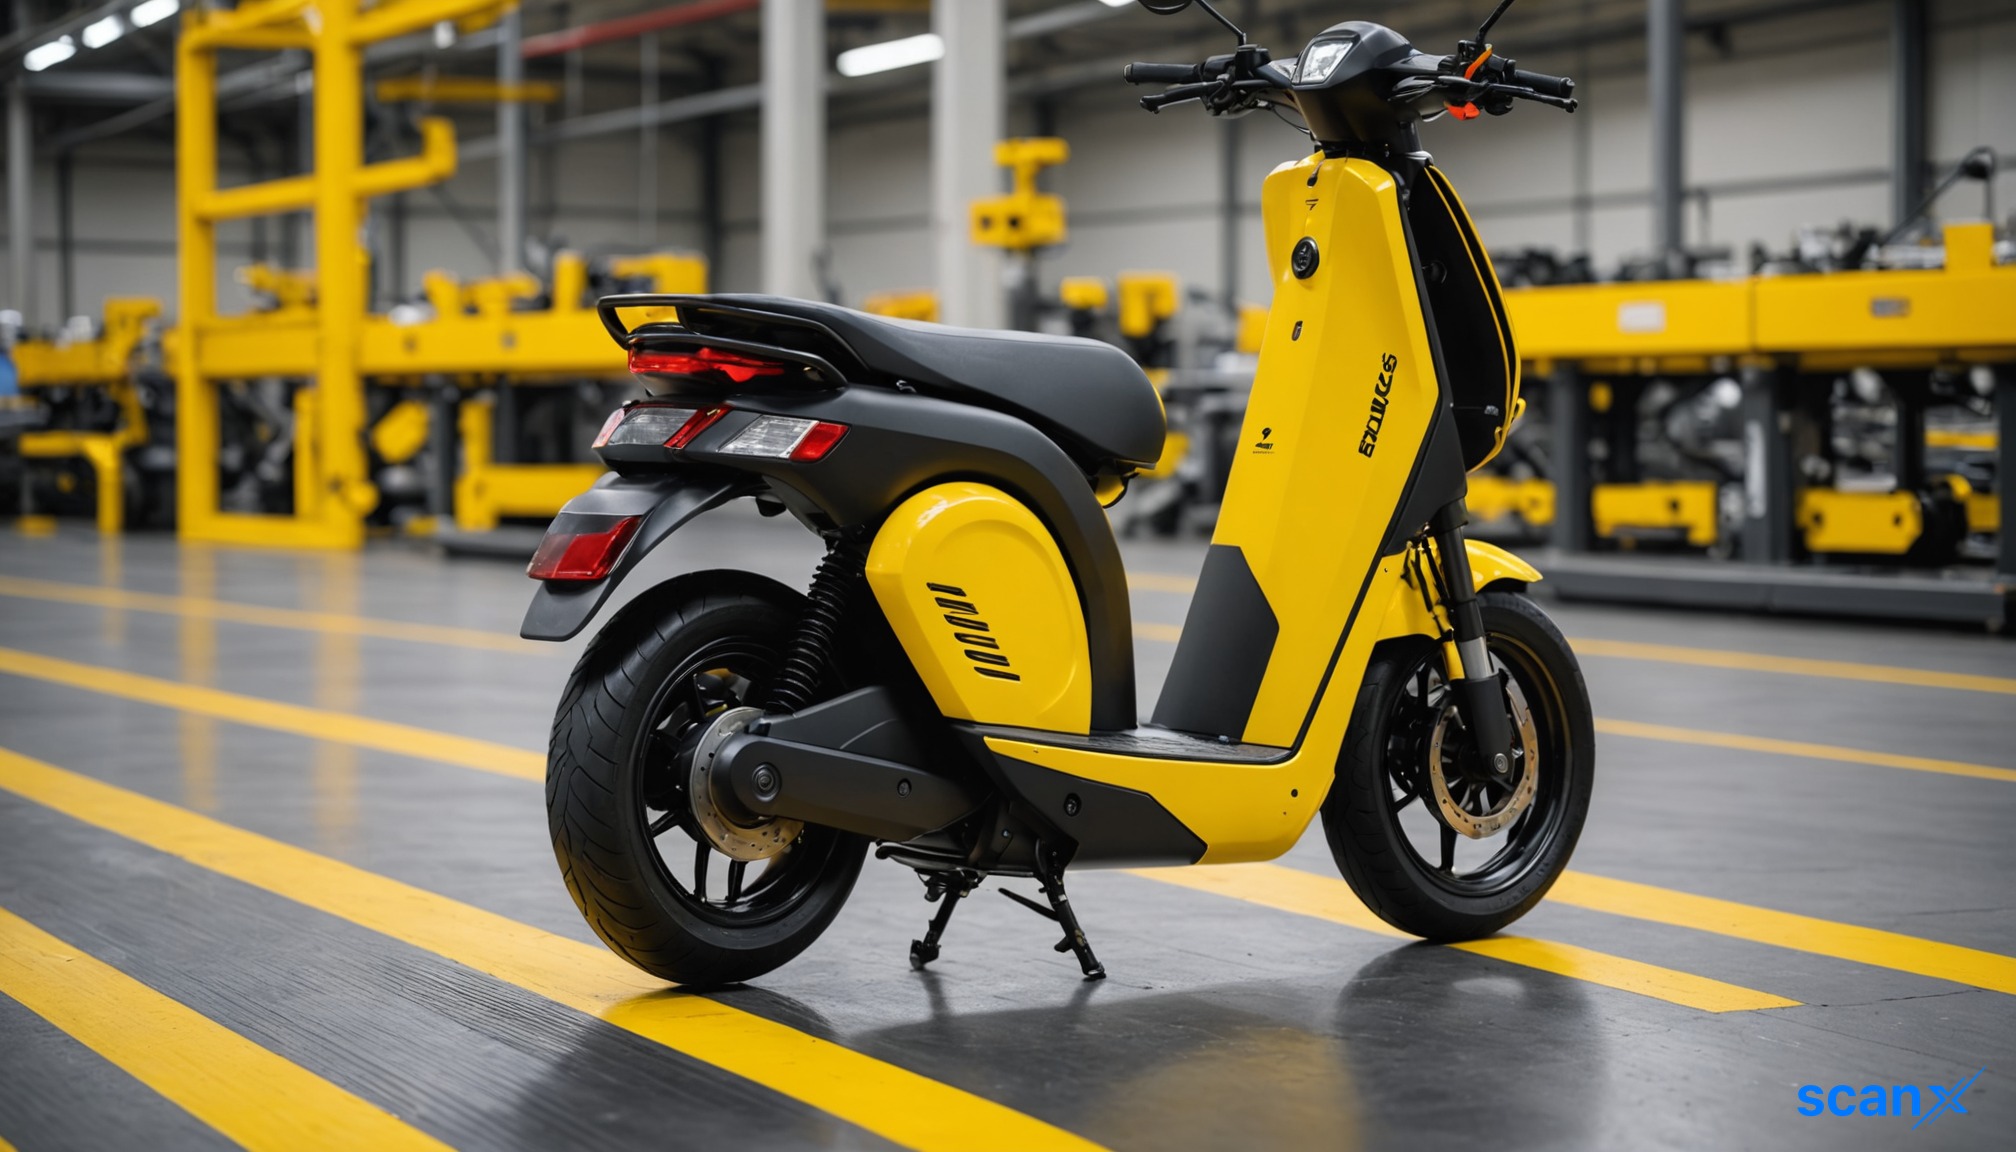
*this image is generated using AI for illustrative purposes only.

Niu Technologies reported total sales volume of 537,457 units for the third quarter of 2026, marking a 15.4% increase from the 465,873 units sold in the same period last year.

The company’s performance was bolstered by robust growth in both domestic and international markets. In China, sales volume rose 9% year-over-year to 490,406 units, while international markets saw a significant surge to 47,051 units from 14,418 units in the third quarter of 2025.

Regional Performance Breakdown

The following table details the sales volume distribution across key markets for the quarter and the year-to-date period:

Market Segment Q3FY26 Units Q3FY25 Units YTD FY26 Units YTD FY25 Units
China Market 490,406 451,455 1,140,546 953,239
International Markets 47,051 14,418 93,222 66,037
Total Sales Volume 537,457 465,873 1,233,768 1,019,276

Product and Technology Highlights

In the Chinese market, the N, M, and F series remained the best-selling product lines, catering to diverse riding needs. The company highlighted the recent recognition of its NIU AIOS system, which received the Red Dot Winner distinction in the "Interface & User Experience Design" category of the Red Dot Award: Brands & Communication Design 2026. This system combines AI capabilities with customizable display features and natural voice control.

For international operations, Niu continued to refine its product portfolio and tailor strategies to local mobility needs, aiming for long-term development in these regions.

What the Numbers Show

A close examination of the regional data reveals a divergence in growth trajectories between the two primary markets. While the China market contributed the bulk of volume with a moderate 9% YoY increase, the international segment expanded more than threefold (from 14,418 to 47,051 units). Although international sales still represent a small fraction of the total volume (approximately 8.7% of Q3FY26 total sales), their rapid expansion rate suggests that global market penetration is becoming an increasingly significant driver of overall volume growth compared to the mature domestic base.

Note: The disclosed sales volume is based on deliveries from manufacturing facilities and may vary slightly from financial accounting measures.

Disclaimer: This article is AI-generated using data from ViewTrade. ScanX is not liable for any inaccuracies.

How will the rapid tripling of international sales volume impact Niu Technologies' gross margins given potential higher logistics and localization costs?

What specific regulatory or infrastructure developments in key international markets are driving the surge to 47,051 units, and are these trends sustainable for Q4?

To what extent will the integration of the AIOS system influence average selling prices (ASP) and customer retention rates in the competitive Chinese e-bike market?

Niu Technologies swings to Q2 loss as supply chain costs squeeze margins

scanx
Reviewed by
Riya DScanX News Team
Key Highlights

Niu Technologies swung to a Q2 net loss of RMB 102.2 million amid margin compression to 16.0%, despite revenue growth of 14.7% to RMB 1,440.4 million driven by a 24.2% rise in e-scooter sales. Operating expenses surged 28.6% due to marketing and AI investments, while China sales were bolstered by electric motorcycles offsetting premium e-bicycle weakness.

powered bylight_fuzz_icon
47894806

*this image is generated using AI for illustrative purposes only.

Niu Technologies reported a net loss of RMB 102.2 million (US$ 0.19 per ADS) for the second quarter of 2026, reversing a net income position from the prior year period, as rising supply chain costs and product mix shifts compressed gross margins to 16.0%. Despite the profitability hit, the Chinese electric scooter maker achieved revenue growth of 14.7% year-over-year to RMB 1,440.4 million (US$ 212.3 million), driven by a robust 24.2% increase in e-scooter sales volume. The company’s shares plunged 14.23% to US$ 2.105 following the results, reflecting investor concern over the widening loss and margin contraction despite top-line growth.

Q2 2026 Financial Highlights

The financial performance was characterized by strong volume growth offset by declining average selling prices and higher operational expenses. Adjusted net loss stood at RMB 98.2 million, compared to adjusted net income of RMB 13.7 million in the same quarter last year.

Metric: Q2 2026 Q2 2025 YoY Change
Revenues (RMB million): 1,440.4 1,255.7 +14.7%
Revenues (US$ million): 212.3 175.3 +21.1%
Gross Margin: 16.0% 20.1% -4.1 pts
Net Income (Loss) (RMB million): (102.2) 5.9 Turn to Loss
Basic & Diluted Net Loss per ADS: US$ 0.19 US$ 0.02 N/A

Revenue Breakdown and Operational Metrics

Total e-scooter sales reached 434,687 units, up 24.2% from the previous year. China remained the dominant market, contributing RMB 1,210.6 million (91.9% of total e-scooter revenues), with sales volume climbing 26.2% to 402,202 units. This growth was partially offset by a 9.2% decline in revenues per e-scooter in China due to competitive pricing pressures.

International e-scooter revenues grew modestly by 3.0% to RMB 106.3 million, supported by a 3.6% increase in unit sales to 32,485. Accessories, spare parts, and services revenues surged 29.0% to RMB 123.5 million, driven by the expansion of the Niu App ecosystem and parts sales.

Revenues (RMB million): Q2 2026 Q2 2025 YoY Change
E-scooter sales — China: 1,210.6 1,056.9 +14.6%
E-scooter sales — International: 106.3 103.1 +3.0%
Accessories, spare parts and services: 123.5 95.7 +29.0%
Total: 1,440.4 1,255.7 +14.7%

Operating Performance and Cost Structure

Cost of revenues increased 20.6% to RMB 1,210.0 million, reflecting higher upstream supply chain costs and lower gross margins on kick-scooters in international markets. Operating expenses rose sharply by 28.6% to RMB 340.6 million, representing 23.6% of revenues compared to 21.1% in Q2 2025. This increase was attributed to front-loaded branding campaigns, expanded domestic store openings, and investments in AI-related technology modules. General and administrative expenses jumped 165.2% to RMB 50.5 million, largely due to RMB 44.2 million in foreign exchange losses versus gains of RMB 25.3 million in the prior year.

What the Numbers Show

The divergence between volume growth and profitability highlights significant structural pressure on Niu Technologies’ business model. While the company successfully shifted its mix toward electric motorcycles—which accounted for approximately 60% of China sales volume—the premium e-bicycle segment faced headwinds from regulatory changes and weaker demand in top-tier cities. CEO Yan Li noted that electric motorcycles helped offset industrywide weakness, but the reliance on lower-margin products and aggressive spending on AI integration (including Niu AI OS and triple-camera systems) has temporarily eroded earnings. The company ended the quarter with RMB 1.48 billion in cash, term deposits, and short-term investments, providing a buffer for its ongoing inventory normalization efforts.

Business Outlook

For the third quarter of 2026, Niu Technologies forecasts revenues between RMB 1,863 million and RMB 2,033 million, representing a year-over-year increase of 10% to 20%. Management indicated that online channels, which grew 50% year-over-year to account for 64% of domestic retail sales, will continue to be a key growth driver. Internationally, overseas electric motorcycle sales rose 50% year-over-year, with an expanded direct-to-retailer network in Europe focusing on higher-end 125cc-plus models. Li stated that the company expects overseas inventory levels to return to healthier norms by year-end.

Disclaimer: This article is AI-generated using data from ViewTrade. ScanX is not liable for any inaccuracies.

How sustainable is Niu's current gross margin of 16.0% given the persistent rise in upstream supply chain costs and competitive pricing pressures in China?

What specific ROI metrics or timeline has management set for its heavy investments in AI-related technology modules, such as the Niu AI OS?

Will the shift toward higher-end 125cc-plus electric motorcycles in Europe successfully offset the margin compression seen in lower-tier international markets?

More News on Niu Technologies - ADR