

Modis Navnirman Q1FY27: PAT rises 25.8% to ₹8.54 crore


Modis Navnirman Ltd posted a 25.81% YoY rise in Q1FY27 PAT to ₹8.54 crore, aided by 27.92% revenue growth to ₹58.26 crore. The firm added a new project in Santacruz West, boosting its pipeline GDV to over ₹800 crore. Management noted temporary margin pressure due to input cost spikes but highlighted strong sales absorption and sequential margin recovery.


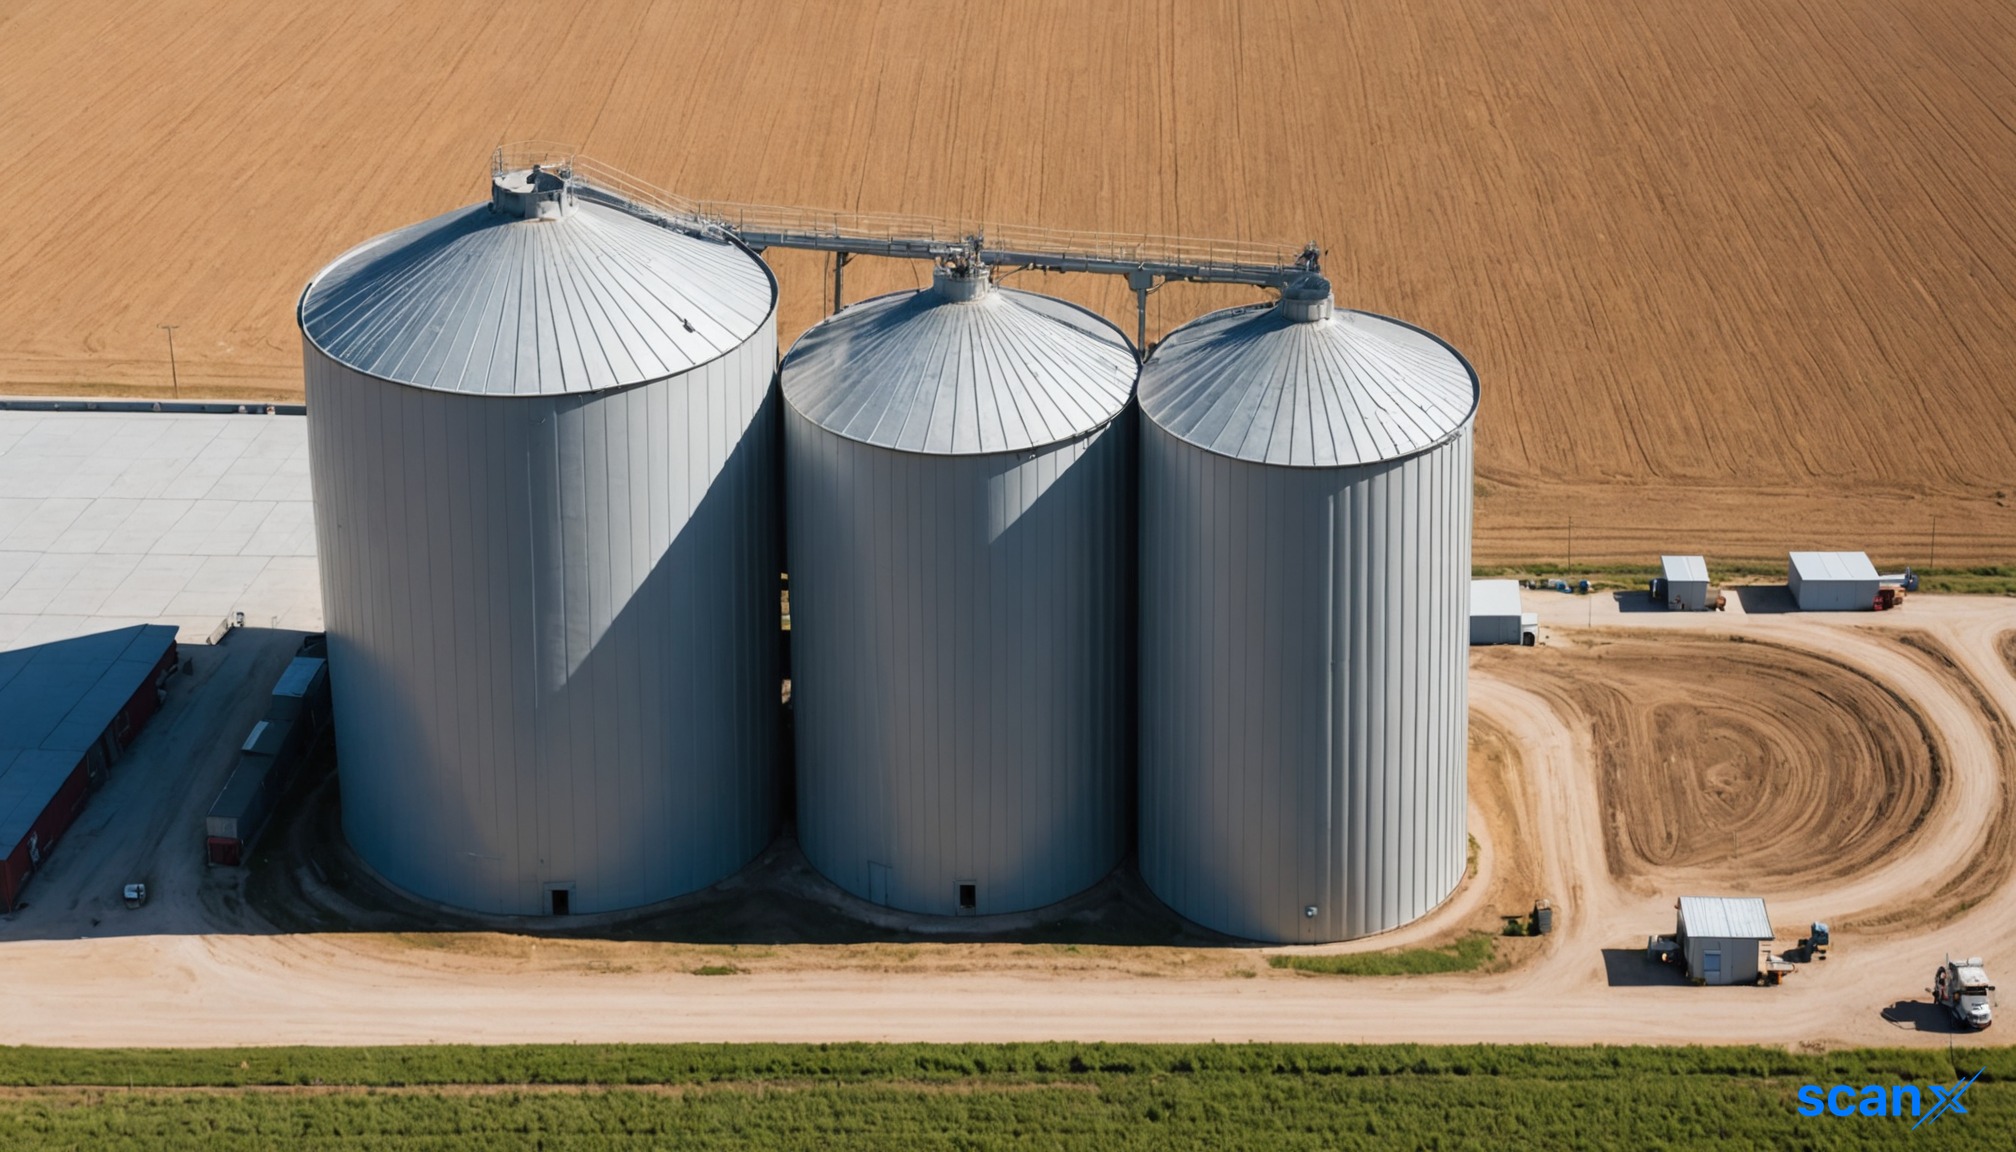
*this image is generated using AI for illustrative purposes only.
Modis Navnirman Ltd company name reported a 25.81% year-on-year increase in profit after tax (PAT) to ₹8.54 crore for the first quarter of FY27. Revenue from operations climbed 27.92% to ₹58.26 crore, driven by accelerated sales momentum and the completion of key projects. The Mumbai-based real estate developer also secured a new redevelopment project, Neel Kiran Society in Santacruz West, marking its expansion into the Khar micro-market beyond its traditional western suburbs stronghold.
The results were filed pursuant to Regulation 30 of the SEBI (Listing Obligations and Disclosure Requirements) Regulations, 2015. During the earnings conference call held on August 10, 2026, management highlighted that the company follows the percentage-of-completion method under Ind AS for revenue recognition. The unaudited consolidated financial statements reflect steady progress on ongoing projects and enhanced future revenue visibility from the expanded pipeline.
Financial Highlights
| Particulars (₹ Cr.) | Q1 FY27 | Q1 FY26 | YoY Change | Q4 FY26 | QoQ Change |
|---|---|---|---|---|---|
| Revenue from Operations | 58.26 | 45.54 | 27.92% | 51.49 | 13.15% |
| EBITDA | 11.65 | 10.20 | 14.25% | 7.56 | 54.13% |
| EBITDA Margin (%) | 19.83% | 22.33% | - | 13.93% | - |
| Profit Before Tax | 11.52 | 10.19 | 13.10% | 5.90 | 95.47% |
| Profit After Tax (PAT) | 8.54 | 6.79 | 25.81% | 4.45 | 92.04% |
| PAT Margin (%) | 14.54% | 14.87% | - | 8.20% | - |
| Basic EPS (₹) | 4.36 | 3.47 | - | 2.25 | - |
Revenue grew sequentially by 13.15% over Q4 FY26, while EBITDA expanded sharply by 54.13% quarter-on-quarter to ₹11.65 crore. Although EBITDA margin contracted slightly year-on-year from 22.33% to 19.83%, it improved significantly from 13.93% in the preceding quarter. PAT margin also recovered to 14.54% from 8.20% in Q4 FY26.
Operational Progress and Pipeline Expansion
Operational momentum accelerated with area sold surging 780% year-on-year to 44,000 sq. ft. in Q1 FY27. Construction advanced steadily across six ongoing projects:
- Rashmi Square reached the 22nd slab, with approximately 80% of inventory booked.
- Rashmi Signature completed its 20th slab, with 65%-70% of inventory booked.
- Rashmi Delight completed its 14th slab, with around 40% sold.
- Rashmi Manorath completed its 13th slab, with 20%-25% sold.
- Rashmi Icon and Rashmi Avenue remain at the plinth stage.
The company secured the Neel Kiran Society project in Santacruz West during the quarter. This brings its upcoming pipeline to five projects totaling 10.50 lakh sq. ft., with a gross development value (GDV) exceeding ₹800 crore. This complements its existing portfolio of six ongoing projects (12.11 lakh sq. ft.) and 14 completed projects (7.22 lakh sq. ft.), creating a total pipeline of 25 premium residential projects across Mumbai and adjoining regions.
Management indicated that Rashmi Paradise will commence this quarter, followed by Rashmi Gold and Sheetal in Q3, and the Khar project in Q4. The Rashmi Govind Dalvi project remains on hold due to government stays in the area. The company is also evaluating opportunities in Parle and Ghatkopar but has not finalized any deals.
What the Numbers Show
The divergence between revenue growth (27.9%) and EBITDA growth (14.3%) year-on-year indicates a temporary compression in operating margins. Management attributed this primarily to cost pressures during the quarter, citing material and labor shortages linked to geopolitical tensions. However, the sequential recovery in both EBITDA and PAT margins suggests that operational efficiencies are stabilizing as these external factors subside. The massive 780% jump in area sold points to successful marketing execution, which should translate into sustained revenue recognition in subsequent quarters as units are handed over or payments are realized. Mahek Dinesh Modi, Whole Time Director & CFO, emphasized that the asset-light redevelopment model keeps land costs low, preserving capital for construction and ensuring timely delivery, which drives word-of-mouth brand equity.
Historical Stock Returns for Modi's Navnirman
| 1 Day | 5 Days | 1 Month | 6 Months | 1 Year | 5 Years |
|---|---|---|---|---|---|
| +6.08% | +8.21% | +5.86% | +30.00% | +0.91% | +0.91% |

How might the ongoing government stays affecting the Rashmi Govind Dalvi project impact the company's overall delivery timeline and cash flow projections for FY27?
What specific strategies is Modis Navnirman employing to mitigate the risk of further margin compression from material and labor cost inflation linked to geopolitical tensions?
Given the expansion into the Khar micro-market, how does the company plan to differentiate its offerings against established competitors in this premium segment?
 19
19






 Create Custom Screeners
  Access 200+ Pre-built Filters
  Use 50+ Readymade Screener





