

Mangalam Cement net profit falls 44% YoY in Q1FY27 on margin squeeze


Mangalam Cement's Q1FY27 net profit fell 44% YoY to ₹18.07 crore, driven by a sharp contraction in EBITDA margins to 11.72% and rising operational expenses, despite stable revenue growth of 1%.


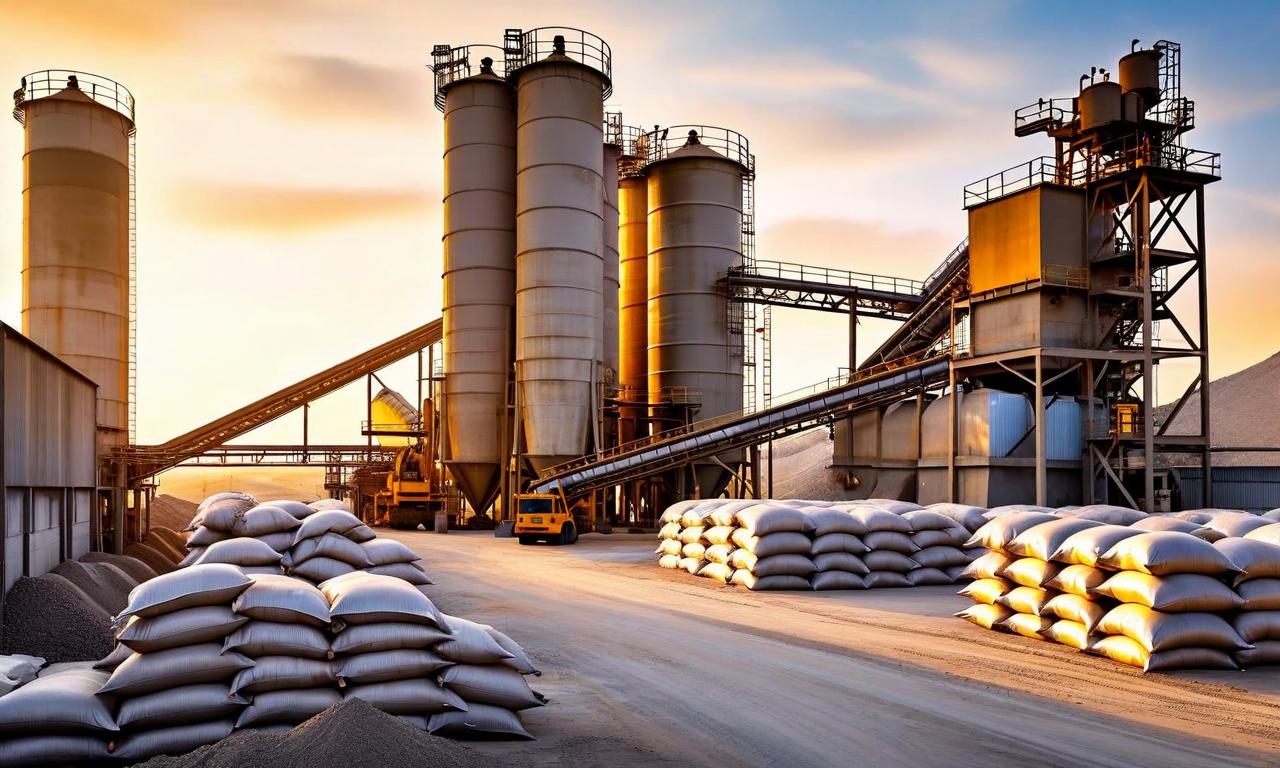
*this image is generated using AI for illustrative purposes only.
Mangalam Cement reported a net profit of ₹18.07 crore for the quarter ended June 30, 2026, down 44% year-on-year from ₹32.26 crore in Q1FY26, as rising operational costs and finance expenses squeezed margins despite stable revenue. The decline highlights increasing pressure on profitability in the cement sector, with EBITDA margins contracting sharply to 11.72% from 16.60% in the prior year period.
The Board of Directors approved the unaudited financial results at a meeting held on August 8, 2026, pursuant to Regulation 30 and Regulation 33 of the SEBI (Listing Obligations and Disclosure Requirements) Regulations, 2015. The company published the results in ‘Financial Express’ (English) all editions and in ‘Rajasthan Patrika’ (Hindi) Kota edition on August 9, 2026, in compliance with Regulation 47 of the SEBI Listing Regulations. Statutory auditors Singhi & Co. conducted a limited review of the financial statements in accordance with Standard on Review Engagements (SRE) 2410 issued by the Institute of Chartered Accountants of India.
Financial Performance Overview
Revenue from operations stood at ₹455.22 crore, broadly in line with ₹451.74 crore in Q1FY26, reflecting a marginal 1% increase. Total income grew slightly to ₹465.82 crore from ₹462.37 crore, as other income remained flat at ₹10.61 crore. However, total expenses increased significantly to ₹442.18 crore from ₹413.22 crore in the previous year, squeezing margins. Finance costs rose to ₹18.27 crore from ₹16.51 crore, contributing to the pressure on pre-tax profits. Depreciation and amortization expenses also increased to ₹22.07 crore from ₹20.15 crore.
The following table summarizes the key financial metrics for the quarter:
| Particulars: | Q1FY27 (₹ in Lakhs) | Q1FY26 (₹ in Lakhs) | Change |
|---|---|---|---|
| Revenue from Operations | 45,521.73 | 45,174.26 | +1% |
| Other Income | 1,060.75 | 1,062.35 | ~Flat |
| Total Income | 46,582.48 | 46,236.61 | +1% |
| Total Expenses | 44,218.29 | 41,322.30 | +7% |
| Profit Before Tax | 2,364.19 | 4,914.31 | -52% |
| Net Profit | 1,807.11 | 3,225.93 | -44% |
EBITDA and Margin Contraction
The EBITDA performance underscores the operational pressure faced during the quarter. EBITDA declined to 534M rupees from 752M rupees year-on-year, representing a significant erosion in operating earnings. Correspondingly, the EBITDA margin contracted sharply to 11.72% from 16.60% in the same period last year, reflecting the impact of rising costs outpacing revenue growth. The key EBITDA metrics are summarized below:
| Metric: | Q1FY27 | Q1FY26 | Change |
|---|---|---|---|
| EBITDA | 534M Rupees | 752M Rupees | -29% |
| EBITDA Margin | 11.72% | 16.60% | -488 bps |
Key Operational and Tax Developments
The company recognized no exceptional items in Q1FY27. The tax expense structure saw significant changes — current tax was ₹7.26 crore, while deferred tax credit stood at ₹1.69 crore, resulting in a total tax expense of ₹5.57 crore. In contrast, Q1FY26 had a current tax of ₹8.73 crore and a deferred tax charge of ₹8.15 crore, leading to a higher total tax outflow of ₹16.88 crore despite higher profits. This shift in deferred tax accounting contributed to the net profit being less severely impacted than the profit before tax.
Basic and diluted earnings per share (EPS) were reported at ₹6.57, down from ₹11.73 in the same quarter last year. The paid-up equity share capital remained unchanged at ₹27.50 crore. The company operates in a single reportable segment: cement. Management noted that the figures for the quarter ended March 31, 2026, are balancing figures between audited full-year results and previously published nine-month unaudited figures.
What the Numbers Show
The divergence between the 52% drop in profit before tax and the 44% decline in net profit highlights the impact of deferred tax credits on the bottom line. The EBITDA margin contraction of nearly 489 basis points year-on-year points to structural cost pressures, with rising finance costs and depreciation outpacing revenue growth as key contributors. While the reduced effective tax burden provided some cushion to the net profit figure, the combination of margin compression and higher operating expenses reflects a challenging operating environment for the company during the quarter.
Historical Stock Returns for Mangalam Cement
| 1 Day | 5 Days | 1 Month | 6 Months | 1 Year | 5 Years |
|---|---|---|---|---|---|
| -0.27% | -1.24% | -9.78% | +22.81% | +31.00% | +115.32% |

What specific cost-control measures or pricing strategies is Mangalam Cement implementing to reverse the 488-basis-point contraction in EBITDA margins?
How will the rising finance costs, which increased to ₹18.27 crore, impact the company's debt servicing capacity and future capital allocation plans?
Given the sector-wide pressure on profitability, does Mangalam Cement plan to pursue capacity expansions or strategic acquisitions in the near term, or will it focus on deleveraging?
 20
20







 Access 50+ Readymade Screeners
  Use 200+ Custom Filters
  Get Full Market Insights





