

Man Industries wins Rs 600 crore order from Domestic and International Customers


- Man Industries wins a confirmed Rs 600 crore work order for pipe supply from domestic and international customers.
- Total disclosed order book stands at Rs 2000 crore, covering 2.06 quarters of average quarterly revenue.
- Book-to-bill ratio is 0.5x against TTM revenue of Rs 3884 crore, indicating steady but not aggressive pipeline growth.
- Recent quarterly execution shows stable margins, with Q1FY27 OPM at 13.62% and net profit of Rs 61.4 crore.
- Balance sheet remains healthy with a current ratio of 1.36x and total liabilities/equity of 1.41x.

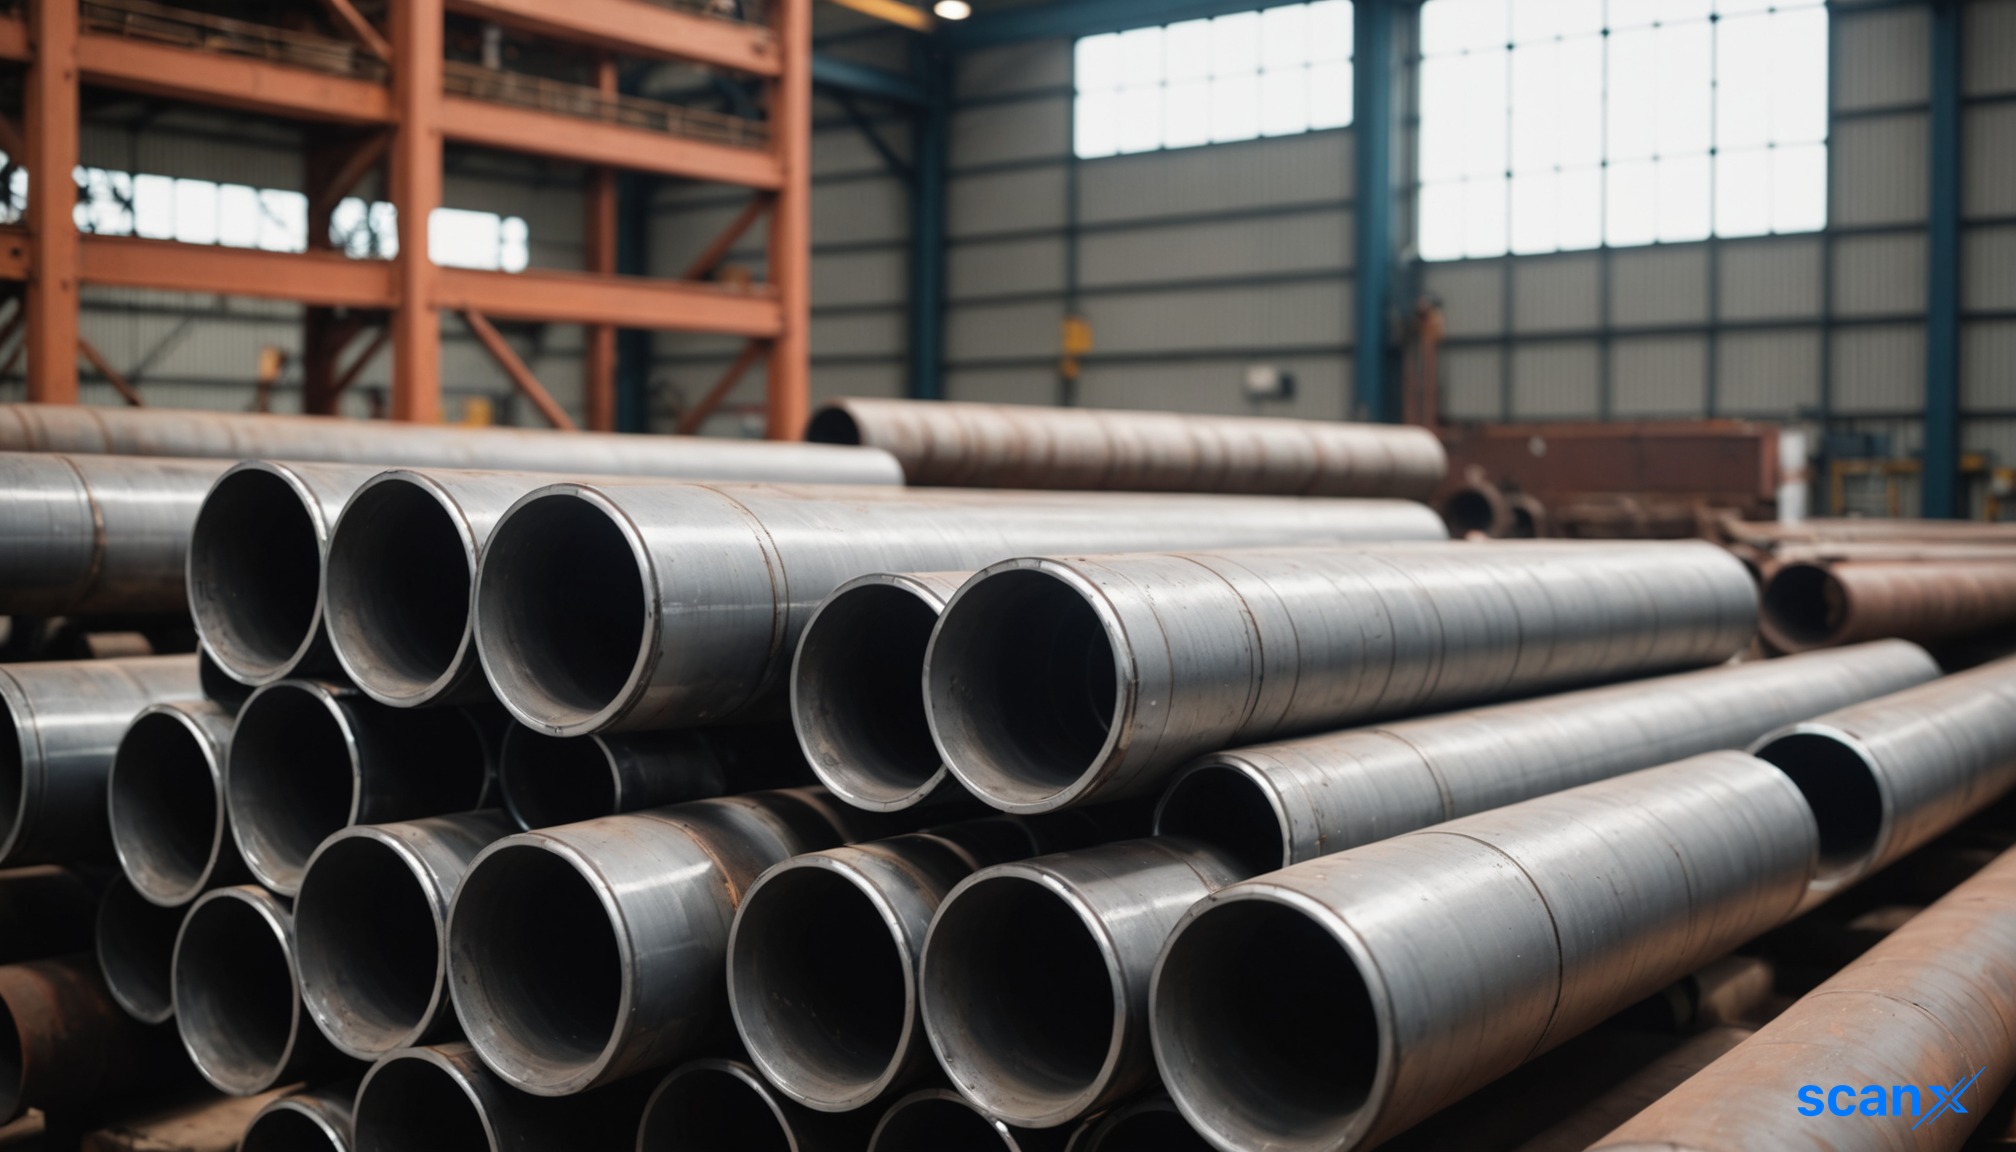

*this image is generated using AI for illustrative purposes only.
Man Industries has secured a confirmed work order valued at Rs 600 crore from domestic and international customers for the supply of various types of pipes. This is a Type A confirmed order, meaning the value is firm and executable upon issuance of the letter of award or work order.
ORDER IN FINANCIAL CONTEXT
The Rs 600 crore order represents approximately 61.8% of the company's average quarterly revenue of Rs 971 crore. The total disclosed order book sums to Rs 2000 crore (sum of the 2 orders disclosed across the last 3 fiscal quarters shown in the table below). Against a trailing twelve-month revenue of Rs 3884 crore, the book-to-bill ratio is 0.5x. The existing backlog covers 2.06 quarters of average quarterly revenue, indicating a moderate pipeline that supports near-term visibility without excessive execution risk.
COMPANY ORDER TRACK RECORD
Order inflow velocity appears stable, with significant mega orders recorded in Q1FY27. The current Rs 600 crore win is consistent with the company's typical per-order size, following two Rs 1000 crore wins earlier in the quarter. The concentration of large awards suggests strong demand in the pipe segment.
| Quarter | Total Order Inflow (Rs Cr) | Key Awarding Entities |
|---|---|---|
| Q1FY27 (Apr-Jun 2026) | 2000.00 | Domestic and International Customers |
EXECUTION AND REVENUE QUALITY
Revenue conversion remains robust. In Q1FY27, the company reported revenue of Rs 1065 crore with an operating profit margin of 13.62%. Net profit stood at Rs 61.4 crore. The operating margin has remained above 12% in the last three quarters, signaling stable execution quality and cost control.
| Quarter | Revenue (Rs Cr) | Net Profit (Rs Cr) | OPM (%) |
|---|---|---|---|
| Q1FY27 | 1065.00 | 61.40 | 13.62% |
| Q4FY26 | 1165.50 | 50.80 | 12.07% |
| Q3FY26 | 838.70 | 55.00 | 15.37% |
REVENUE GROWTH - ORDER WINS TRANSLATING TO REVENUE
As Man Industries has sustained order wins, with a notable inflow of Rs 2000 crore in Q1FY27, its annual revenue has grown from Rs 3557.20 crore in FY25 to Rs 3563.90 crore in FY26, representing a YoY growth of +0.2% based on the latest annual data. While top-line growth was modest in FY26, net profit grew by 10.2%, reflecting improved operational efficiency.
WORKING CAPITAL AND EXECUTION CAPACITY
The balance sheet shows a current ratio of 1.36x, providing adequate liquidity to fund working capital requirements for the new orders. Total liabilities/equity stands at 1.41x, which includes trade payables and other non-debt liabilities, indicating a moderate leverage profile. Operating cashflow in FY25 was positive at Rs 68 crore, though free cashflow was negative at -Rs 86.3 crore due to capex outflows of Rs 154.3 crore.
WHAT TO WATCH
- Execution rate: Monitor whether the Rs 600 crore order converts to revenue within the stated 6 to 9 month timeline.
- OPM trajectory: Watch if the operating profit margin on this new order aligns with the historical average of ~13%.
- Client concentration: Note that all recent orders come from "Domestic and International Customers," limiting visibility into specific client risk.
- Cash conversion: Track if operating cashflow improves in upcoming quarters as backlog executes.
KEY OBSERVATIONS
- Backlog signal: Book-to-bill of 0.5x. At this level, execution capacity is balanced with order intake, neither overly stretched nor idle.
- Valuation check (as of 10 Sep 2026): P/E of 29.1x against ROCE of 17.17%. At the time of this article, valuation was pricing in execution improvement not yet visible in return ratios. (P/E is price-derived and will change; ROCE is from audited financials)
Historical Stock Returns for Man Industries
| 1 Day | 5 Days | 1 Month | 6 Months | 1 Year | 5 Years |
|---|---|---|---|---|---|
| +1.17% | -5.82% | +5.62% | +98.15% | +133.15% | +660.98% |

 19
19











 Create Custom Screeners
  Access 200+ Pre-built Filters
  Use 50+ Readymade Screener





