

Maersk Q2FY26 Results: Revenue rises 20% to $15.8 billion


- Revenue rose 20% YoY to $15.8 billion, driven by higher spot rates
- EBIT reached $1.6 billion; free cash flow turned positive at $549 million
- Full-year underlying EBIT guidance upgraded to $4.5-$6.5 billion
- Ocean segment revenue grew 23% as freight rates surged 22% YoY
- Logistics & Services posted 15% revenue growth and 5.1% EBIT margin

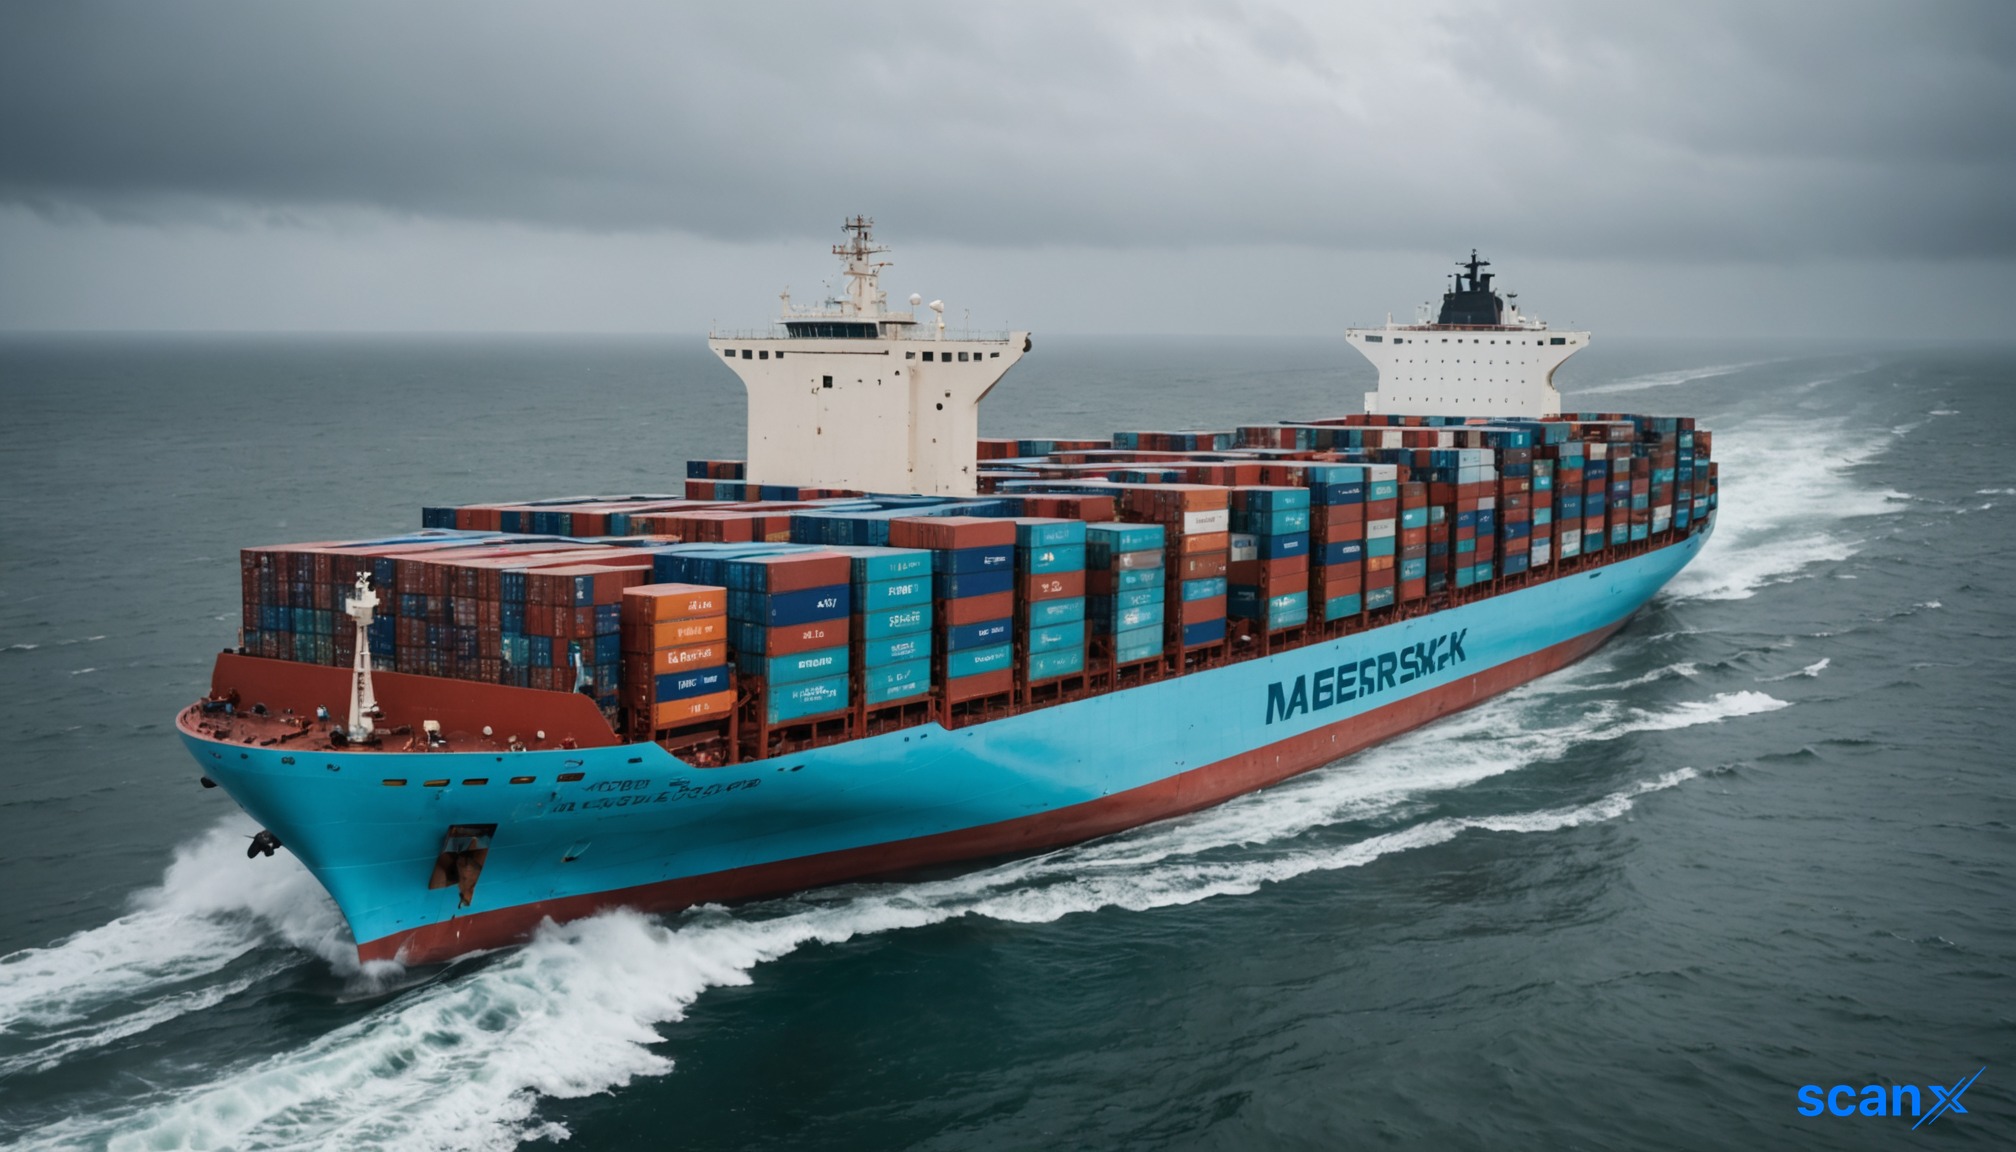

*this image is generated using AI for illustrative purposes only.
A P Moller Maersk (OTC: AMKBY) reported a 20% year-on-year rise in Q2 2026 revenue to $15.8 billion, driven by higher spot rates and robust demand across its Ocean and Logistics segments. The shipping giant upgraded its full-year guidance, projecting an underlying EBIT of $4.5 billion to $6.5 billion.
Financial Performance
The company delivered an EBITDA of $3 billion and an EBIT of $1.6 billion for the quarter. Free cash flow turned positive at $549 million, compared with a negative $373 million in the same period last year. This improvement was supported by stronger earnings, though partially offset by a buildup in working capital due to higher receivables and bunker inventory costs.
| Metric | Q2 2026 | Change |
|---|---|---|
| Revenue | $15.8 billion | +20% YoY |
| EBITDA | $3 billion | N/A |
| EBIT | $1.6 billion | N/A |
| Free Cash Flow | $549 million | Positive vs Negative |
Segment Highlights
The Ocean segment contributed significantly to the top-line growth, with revenue rising 23% year-on-year to $10.5 billion. Average loaded freight rates increased by 22% year-on-year and 32% sequentially. Loaded volumes grew by 4.1% to 3.4 million FFE. EBIT for the Ocean segment reached $935 million, supported by strong spot rates that more than compensated for elevated bunker costs, which rose 44% year-on-year.
Logistics & Services reported revenue growth of 15% to $4.2 billion. The segment achieved an EBIT margin of 5.1%, marking the ninth consecutive quarter of year-on-year margin improvement. Forwarding revenue grew 32%, while Landside revenue increased 14%. Solutions revenue rose 11%, but its EBIT margin decreased to 1.7% due to white space costs associated with new warehouse capacity.
Terminals revenue grew 11% to $1.4 billion, driven by a 7.1% increase in revenue per move. Volumes increased by 2.2%. The segment maintained a return on invested capital of 14.8%.
What the Numbers Show
Freight rates were the primary driver of profitability, contributing approximately $1.6 billion to EBITDA. This gain was partially offset by a $612 million negative impact from higher bunker prices. The divergence highlights that while rate hikes absorbed most cost inflation, energy price volatility remains a significant drag on margins.
Outlook and Strategy
Management upgraded the full-year guidance based on an expectation of 4% container market volume growth. The company expects positive free cash flow for the year. Capital expenditure guidance remains unchanged at $10 billion to $11 billion for the 2025-26 and 2026-27 periods.
Operationally, Maersk is gradually reintroducing services to the Bab-el-Mandeb Strait, with four services currently active. CEO Vincent Clerc noted that structural bottlenecks in terminal capacity and landside infrastructure are likely to cause frequent rate volatility in the coming years.

How might the reintroduction of services through the Bab-el-Mandeb Strait impact Maersk's exposure to geopolitical risks and potential future rate volatility?
Given the 44% year-on-year rise in bunker costs, what hedging strategies is Maersk employing to protect margins against continued energy price inflation?
Will the $10 billion to $11 billion capital expenditure plan prioritize fleet modernization or infrastructure expansion to address the cited terminal capacity bottlenecks?
 17
17





 Create Custom Screeners
  Access 200+ Pre-built Filters
  Use 50+ Readymade Screener





