

Kalpataru Projects secures ₹4,000 crore UAE gas pipeline order


- Kalpataru Projects International secured a ₹4,000 crore EPC order for a gas pipeline in the UAE
- Total disclosed order book for last three quarters stands at ₹19,469 crore across 7 orders
- Backlog provides 2.82 quarters of coverage against average quarterly revenue of ₹6,902.93 crore
- Operating Profit Margins remained stable between 7.26% and 8.77% in recent quarters

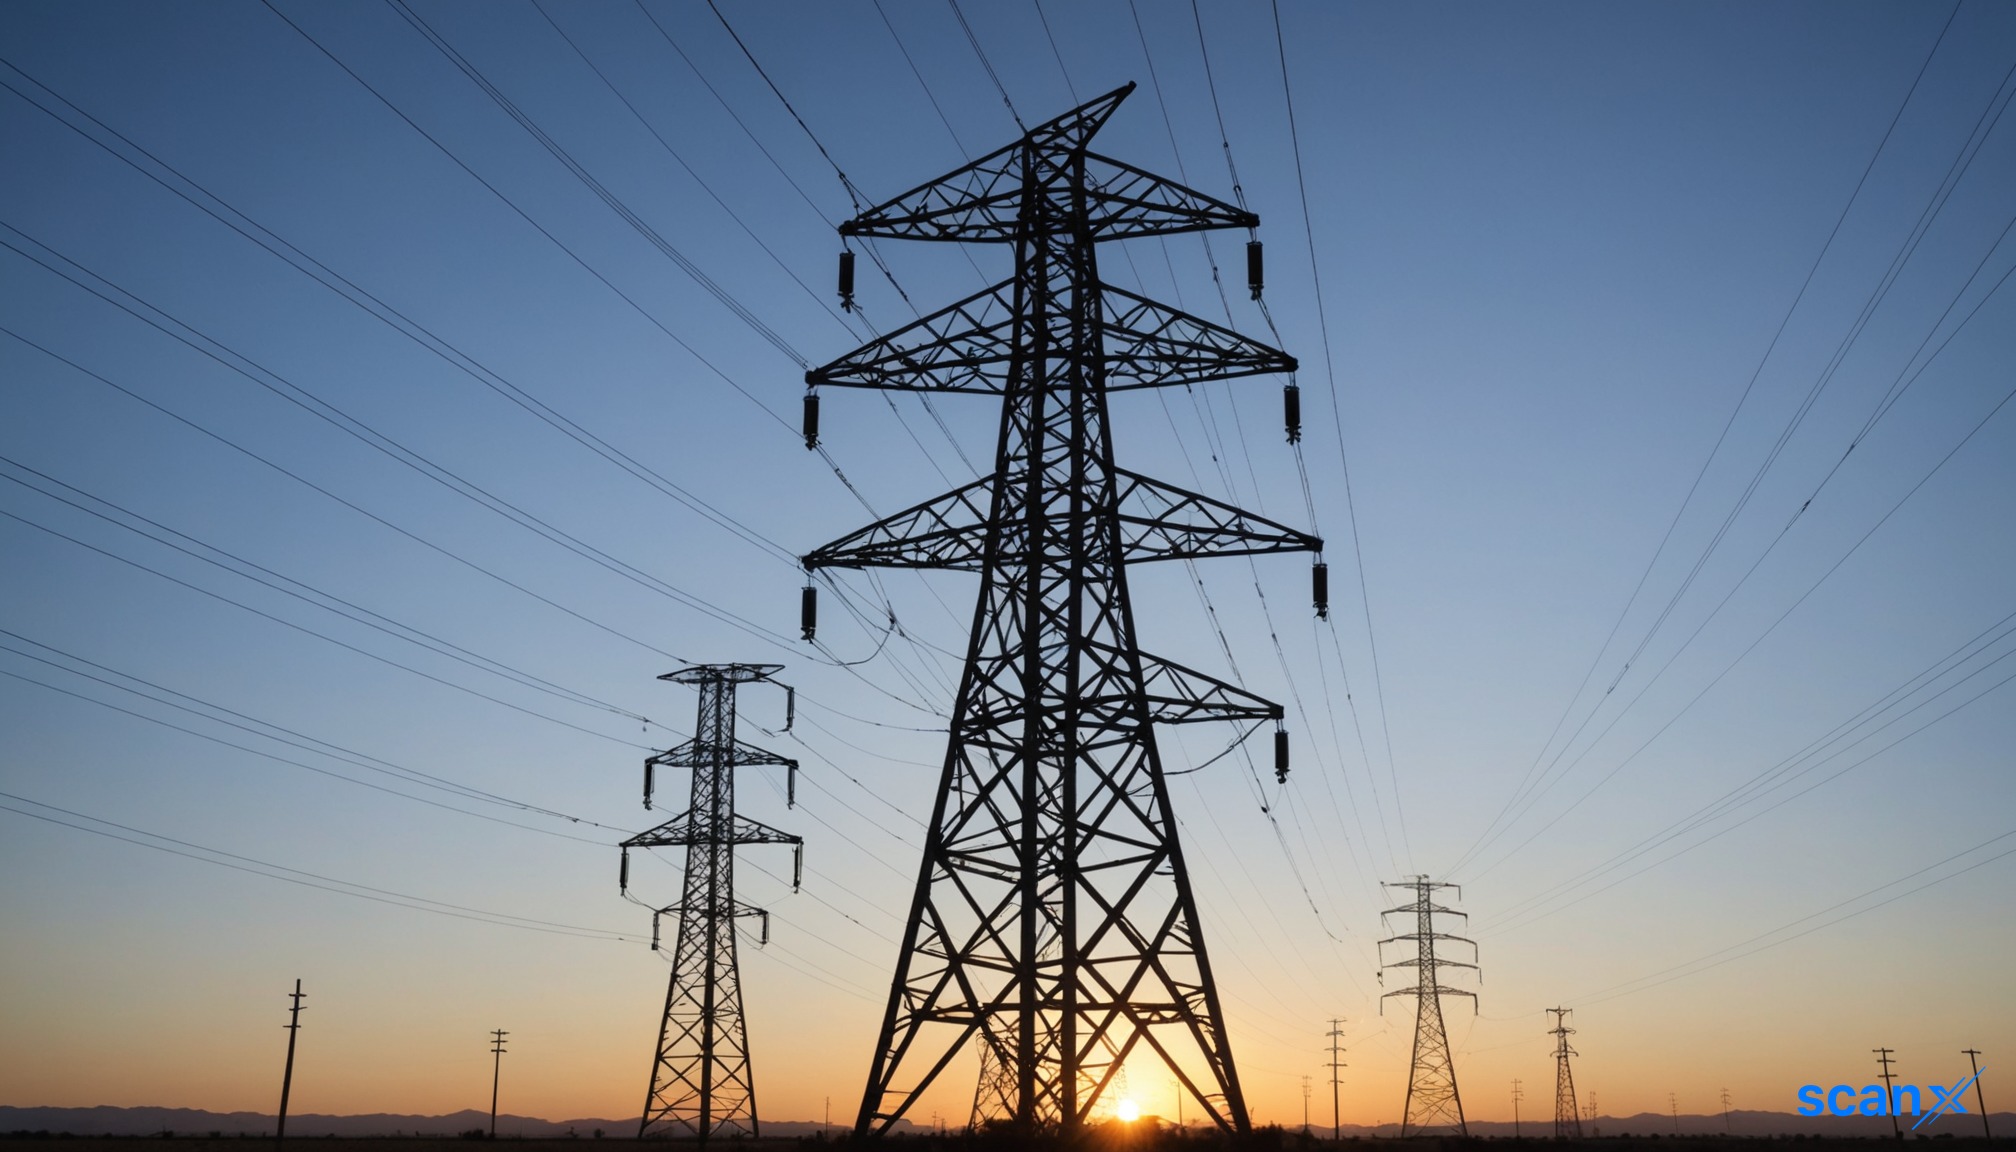

*this image is generated using AI for illustrative purposes only.
Kalpataru Projects International has secured a mega order worth ₹4,000.00 crore for the Engineering, Procurement and Construction (EPC) of a gas pipeline project in the United Arab Emirates. The awarding entity is classified as International, with the specific name not disclosed in the filing.
Order Details and Financial Context
The newly disclosed order is dated 28 September 2026. It represents a significant addition to the company's recent inflow. The total disclosed order book for the last three fiscal quarters now stands at ₹19,469.00 crore across 7 orders. This backlog provides 2.82 quarters of coverage against the average quarterly revenue of ₹6,902.93 crore.
The table below summarizes the quarterly order inflow as per pre-computed data:
| Quarter | Total Order Inflow (₹ Cr) | Order Count | Key Awarding Entities |
|---|---|---|---|
| Q2FY27 (Jul-Sep 2026) | 5,551.00 | 2 | Domestic clients |
| Q1FY27 (Apr-Jun 2026) | 9,918.00 | 4 | Various |
Note: The pre-computed quarterly summary lists specific totals for Q2FY27 and Q1FY27. The new order is included in the total disclosed book figure provided in the input data.
Recent Order History
The following table details the order history, including the latest international win and previous domestic and overseas contracts:
| Date | Value (₹ Cr) | Classification | Terms / Scope |
|---|---|---|---|
| 2026-09-28 | 4,000.00 | Mega | EPC of a gas pipeline project in the United Arab Emirates |
| 2026-09-24 | 2,025.00 | Mega | Projects in Power Transmission & Distribution (T&D), Buildings and Factories (B&F), and Oil & Gas businesses |
| 2026-08-14 | 3,526.00 | Mega | EPC Order for an industrial plant in India; Orders in T&D business in India; Residential building orders in India |
| 2026-06-30 | 2,957.00 | Mega | Orders in T&D business in India and overseas; Orders in B&F business in India; Water business in Middle East (JV/consortium) |
| 2026-06-29 | 2,957.00 | Mega | Orders in T&D business in India and overseas; Orders in B&F business in India; Water business in Middle East (JV/consortium) |
| 2026-06-01 | 2,002.00 | Mega | Orders in T&D business in overseas market; Orders in B&F business in India; Railways business in India |
| 2026-05-31 | 2,002.00 | Mega | Orders in T&D business in overseas market; Orders in B&F business in India; Railways business in India |
Execution and Revenue Quality
Revenue conversion has shown variability, with Q4FY26 delivering the highest topline among the last three quarters. Operating Profit Margins (OPM) have remained within a narrow band of 7.26% to 8.77%, indicating stable execution efficiency despite fluctuating revenue volumes. There are no net loss quarters in the recent period.
| Quarter | Revenue (₹ Cr) | Net Profit (₹ Cr) | OPM (%) |
|---|---|---|---|
| Q1FY27 | 6,485.20 | 311.50 | 8.77% |
| Q4FY26 | 7,880.70 | 430.60 | 8.23% |
| Q3FY26 | 6,693.80 | 149.10 | 7.26% |
Revenue Growth Context
As Kalpataru Projects International sustains order wins across T&D, B&F, and other verticals, its annual revenue has grown from ₹16,435.60 crore in FY23 to ₹27,247.90 crore in FY26. This trend aligns with the high volume of mega orders disclosed in recent quarters.
Working Capital and Balance Sheet
The company maintains a Current Ratio of 1.25x. The Total Liabilities/Equity ratio stands at 2.58x, which includes trade payables and other non-debt liabilities. Operating Cashflow was positive at ₹1,534.40 crore in FY26, supporting the conversion of accruals into cash.
Key Observations
- Backlog signal: The total disclosed order book of ₹19,469.00 crore provides 2.82 quarters of coverage against average quarterly revenue.
- Geographic diversification: The new order is for a project in the United Arab Emirates, adding to the mix of domestic and overseas orders.
- Valuation check (as of 28 Sep 2026): P/E of 21.0x against ROCE of 20.51%.
Historical Stock Returns for Kalpataru Projects International
| 1 Day | 5 Days | 1 Month | 6 Months | 1 Year | 5 Years |
|---|---|---|---|---|---|
| -0.82% | -1.23% | +0.29% | +14.21% | +10.49% | 0.0% |

How will the execution timeline and margin profile of the ₹4,000 crore UAE gas pipeline project compare to Kalpataru's historical international EPC contracts?
What impact will the increased exposure to Middle Eastern energy infrastructure have on Kalpataru's currency hedging strategies and geopolitical risk management?
Given the 2.82-quarter backlog coverage, what is the projected order inflow required in Q3FY27 to sustain the current revenue growth trajectory?
 18
18








 Access Market Heat-map & Insights
  Create, Save & Share your Screener
  Use 200+ Screening Filters





