

Tuni Textile Q2FY27 Results: Net profit up 114% YoY to ₹1.66 lakh


- Net profit for Q2FY27 rose 113.6% YoY to ₹1.66 lakh
- Net revenue from operations increased 17.4% YoY to ₹35.10 lakh
- Half-year net profit for H1FY27 reached ₹2.05 lakh, up from ₹0.78 lakh in H1FY26
- Earnings Per Share (EPS) doubled to ₹0.09 from ₹0.04 in the previous year

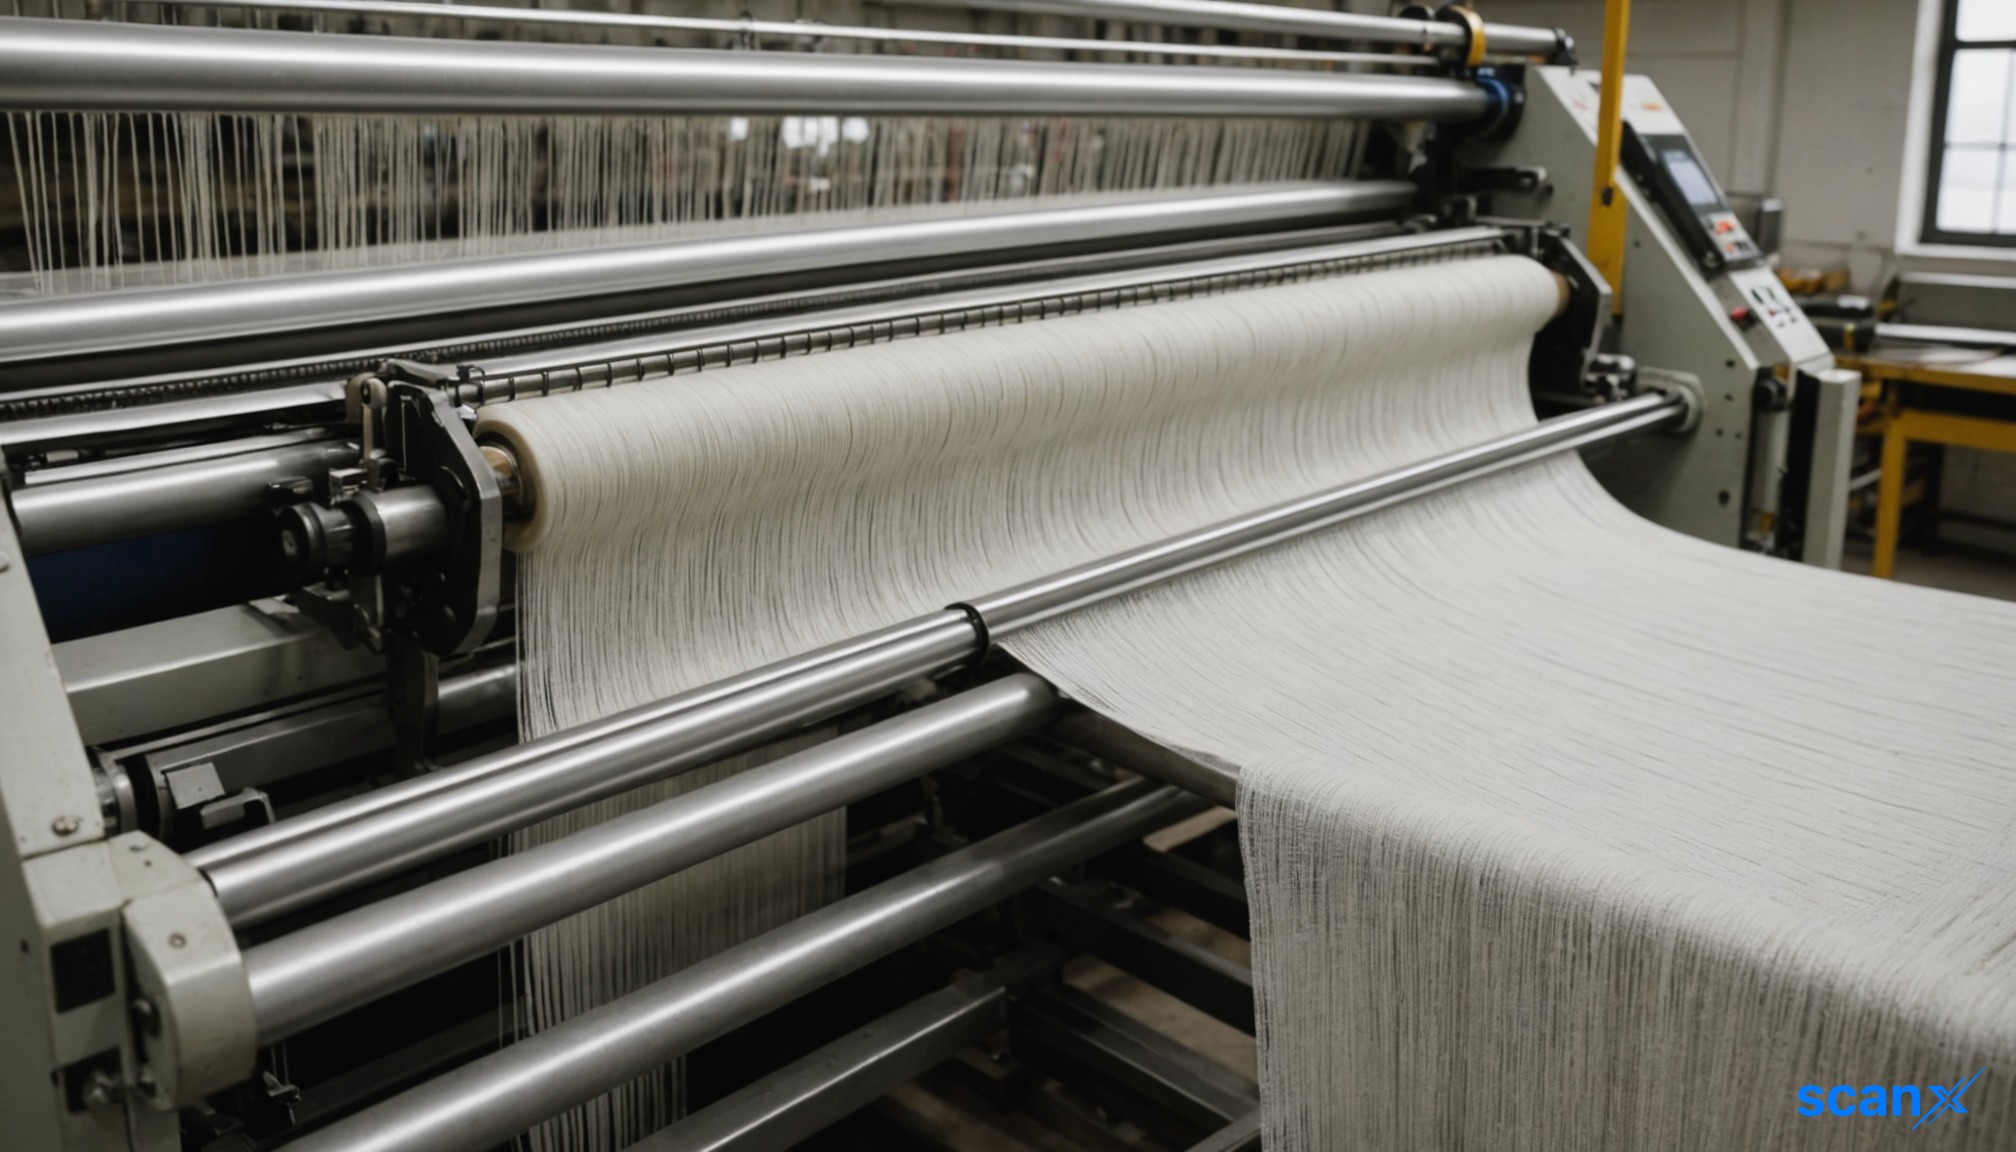

*this image is generated using AI for illustrative purposes only.
Tuni Textile Mills Limited reported a 113.6% year-on-year increase in net profit for the second quarter of FY27 (Q2FY27), reaching ₹1.66 lakh. The Mumbai-based textile manufacturer also recorded a 17.4% YoY growth in net revenue from operations, which stood at ₹35.10 lakh.
The company’s performance reflects improved operational efficiency alongside top-line expansion. For the half-year ended September 30, 2026, the net profit for the period rose to ₹2.05 lakh from ₹0.78 lakh in the corresponding period of the previous year, marking a significant recovery in profitability.
Financial Performance Overview
The following table details the key financial metrics for Q2FY27 compared to Q2FY26 and the full-year FY26 figures:
| Metric | Q2FY27 (₹ lakh) | Q2FY26 (₹ lakh) | Change (%) | H1FY27 (₹ lakh) | FY26 (₹ lakh) |
|---|---|---|---|---|---|
| Net Revenue from Operations | 35.10 | 29.90 | +17.4% | 58.57 | 114.84 |
| Net Profit for the Period | 1.66 | 0.78 | +113.6% | 2.05 | 1.54 |
| EPS (Basic & Diluted) | 0.09 | 0.04 | +125.0% | 0.12 | 0.07 |
Note: Figures are derived from the unaudited standalone financial results published on October 16, 2026.
What the Numbers Show
A notable divergence exists between the revenue growth and profit acceleration. While net revenue grew by 17.4%, net profit surged by 113.6%. This disproportionate jump suggests that the company either benefited from reduced operating costs or non-operating income contributions during the quarter. The Earnings Per Share (EPS) also doubled from ₹0.04 to ₹0.09, indicating enhanced value creation for shareholders relative to the equity base, which remained stable at 13.06 lakh shares.
Balance Sheet and Equity Structure
The company’s paid-up equity capital remained unchanged at ₹13.06 lakh across the reported periods. Other equity components showed movement, rising from ₹1.13 lakh in Q2FY26 to ₹3.44 lakh in Q2FY27, reflecting retained earnings accumulation over the last four quarters. The consistent share count ensures that the profit growth directly translates to per-share metrics without dilution effects.
Historical Stock Returns for Tuni Textile Mills
| 1 Day | 5 Days | 1 Month | 6 Months | 1 Year | 5 Years |
|---|---|---|---|---|---|
| -1.98% | -10.81% | +86.79% | +120.00% | +171.23% | 0.0% |

What specific cost optimization measures or non-operating income sources drove the 113.6% profit surge despite only 17.4% revenue growth?
How will Tuni Textile Mills allocate its significantly increased retained earnings to fund future capacity expansion or debt reduction?
Can the company sustain this disproportionate profit growth in H2FY27 if raw material costs rise or demand softens?
 15
15










 Access 50+ Readymade Screeners
  Use 200+ Custom Filters
  Get Full Market Insights





