

Integrated Proteins Q1 Results: Net profit jumps to ₹36.26 lakh


Integrated Proteins Limited delivered a strong Q1FY26 performance with net profit jumping to ₹36.26 lakh from ₹0.01 lakh in Q1FY25. Revenue grew 8.8% YoY to ₹1,056.38 lakh. The sharp profit increase reflects improved operational efficiency and margin expansion during the quarter.

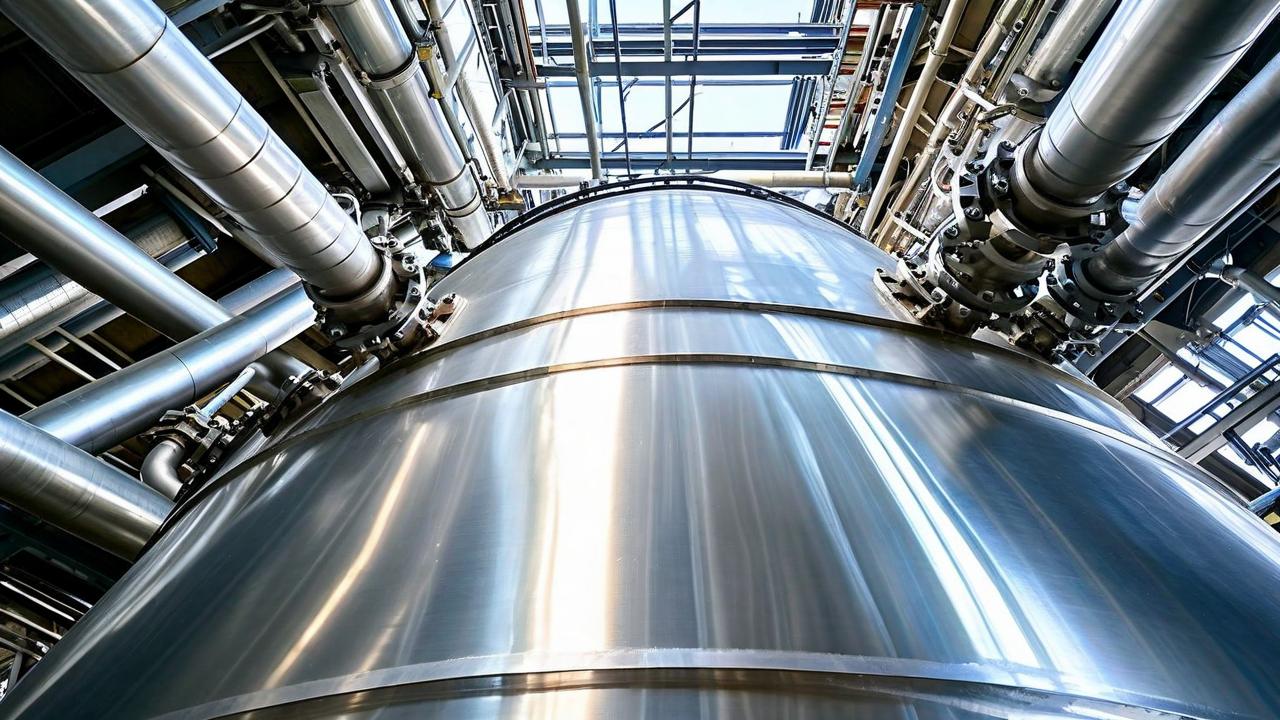

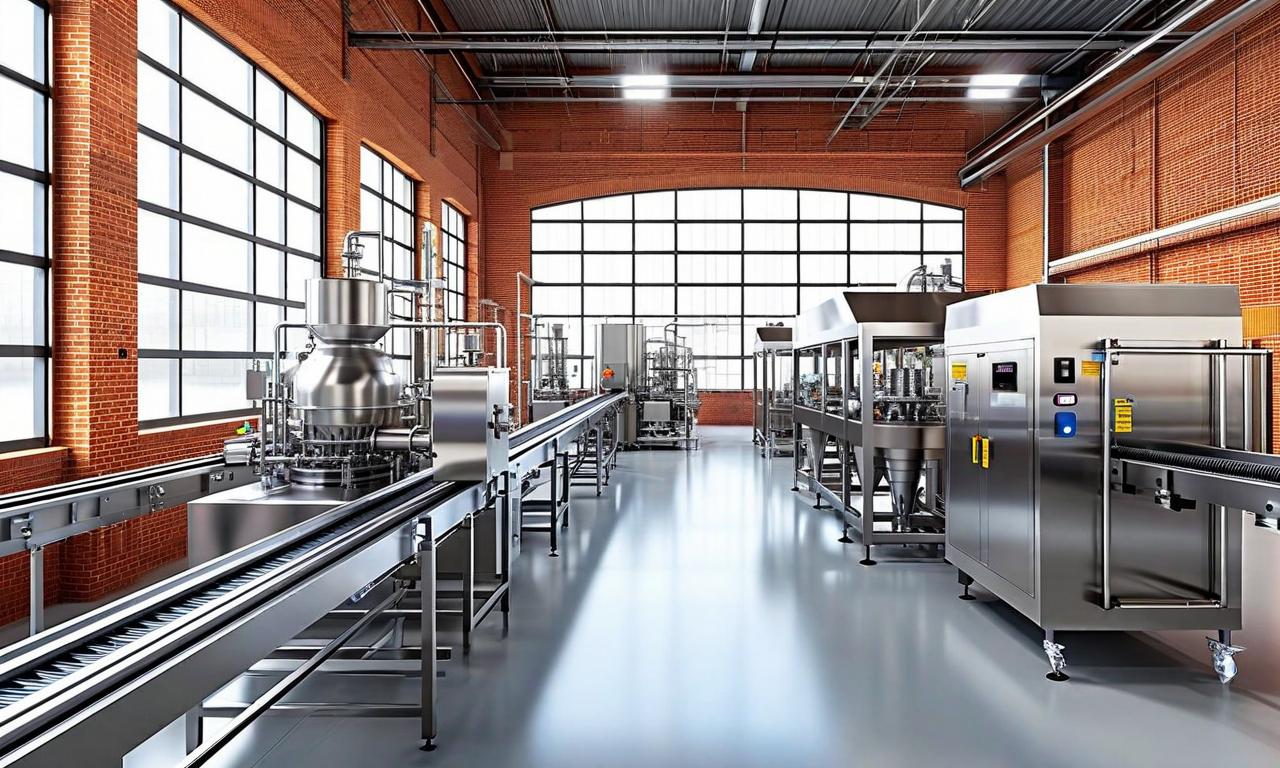
*this image is generated using AI for illustrative purposes only.
Integrated Proteins Limited reported a standalone net profit of ₹36.26 lakh for the quarter ended June 30, 2026, marking a substantial recovery from the near-zero profit of ₹0.01 lakh recorded in the same period last year. Revenue from operations expanded by 8.8% year-on-year to ₹1,056.38 lakh, up from ₹971.07 lakh in Q1FY25.
The company’s profitability improved sharply as pre-tax profits rose to ₹48.45 lakh from ₹0.01 lakh in the prior year. This operational turnaround was supported by higher top-line growth, with revenue also increasing 88.5% quarter-on-quarter compared to ₹560.53 lakh in Q4FY25.
Financial Performance
The Board of Directors approved the unaudited standalone financial results at a meeting held on August 14, 2026. The figures were reviewed by the Audit Committee and prepared in accordance with Indian Accounting Standard (Ind AS) 34.
| Metric: | Q1FY26 | Q1FY25 | Change |
|---|---|---|---|
| Revenue from Operations: | ₹1,056.38 lakh | ₹971.07 lakh | +8.8% |
| Net Profit Before Tax: | ₹48.45 lakh | ₹0.01 lakh | +484,400% |
| Net Profit After Tax: | ₹36.26 lakh | ₹0.01 lakh | +364,500% |
| EPS (Basic): | ₹0.19 | ₹0.00 | - |
Earnings per share (basic and diluted) stood at ₹0.19 for the quarter, compared to ₹0.00 in the corresponding period of the previous fiscal year. For the full year ended March 31, 2026, the company reported a net profit of ₹22.50 lakh on revenue of ₹994.07 lakh.
What the Numbers Show
The divergence between revenue growth and profit expansion highlights a significant improvement in cost efficiency or margin structure. While revenue grew moderately by 8.8% year-on-year, pre-tax profits surged over 48,000 times, suggesting that fixed costs were better absorbed or variable costs declined significantly relative to sales volume. This indicates a potential inflection point in operational leverage for the protein processing business.
Historical Stock Returns for Integrated Proteins
| 1 Day | 5 Days | 1 Month | 6 Months | 1 Year | 5 Years |
|---|---|---|---|---|---|
| +0.39% | -2.35% | -4.29% | +356.45% | +217.62% | +4,321.87% |

What specific operational changes or cost-saving measures drove the disproportionate surge in pre-tax profits compared to moderate revenue growth?
Can Integrated Proteins sustain this improved margin structure in Q2FY26, or was the Q1 result driven by one-off factors?
How does the current EPS of ₹0.19 compare to analyst expectations, and what is the consensus forecast for full-year FY26 profitability?
 15
15










 Access 50+ Readymade Screeners
  Use 200+ Custom Filters
  Get Full Market Insights





