

GE Vernova T&D India Q1FY27 Results: Revenue up 38% to ₹18.4B, PAT rises 25%


- Revenue rose 38% YoY to ₹18.4 billion in Q1FY27, driven by volume and product mix improvements
- Profit before tax increased 25% to ₹4.9 billion, reflecting strong operational leverage
- Order backlog stands at ₹209.3 billion as on June 30, 2026, ensuring future revenue visibility
- Company generated ₹4.3 billion in cash, maintaining a debt-free status with ₹29.3 billion available cash
- Proposed dividend of ₹2.6 billion for FY26 reflects a payout ratio of 20.8%

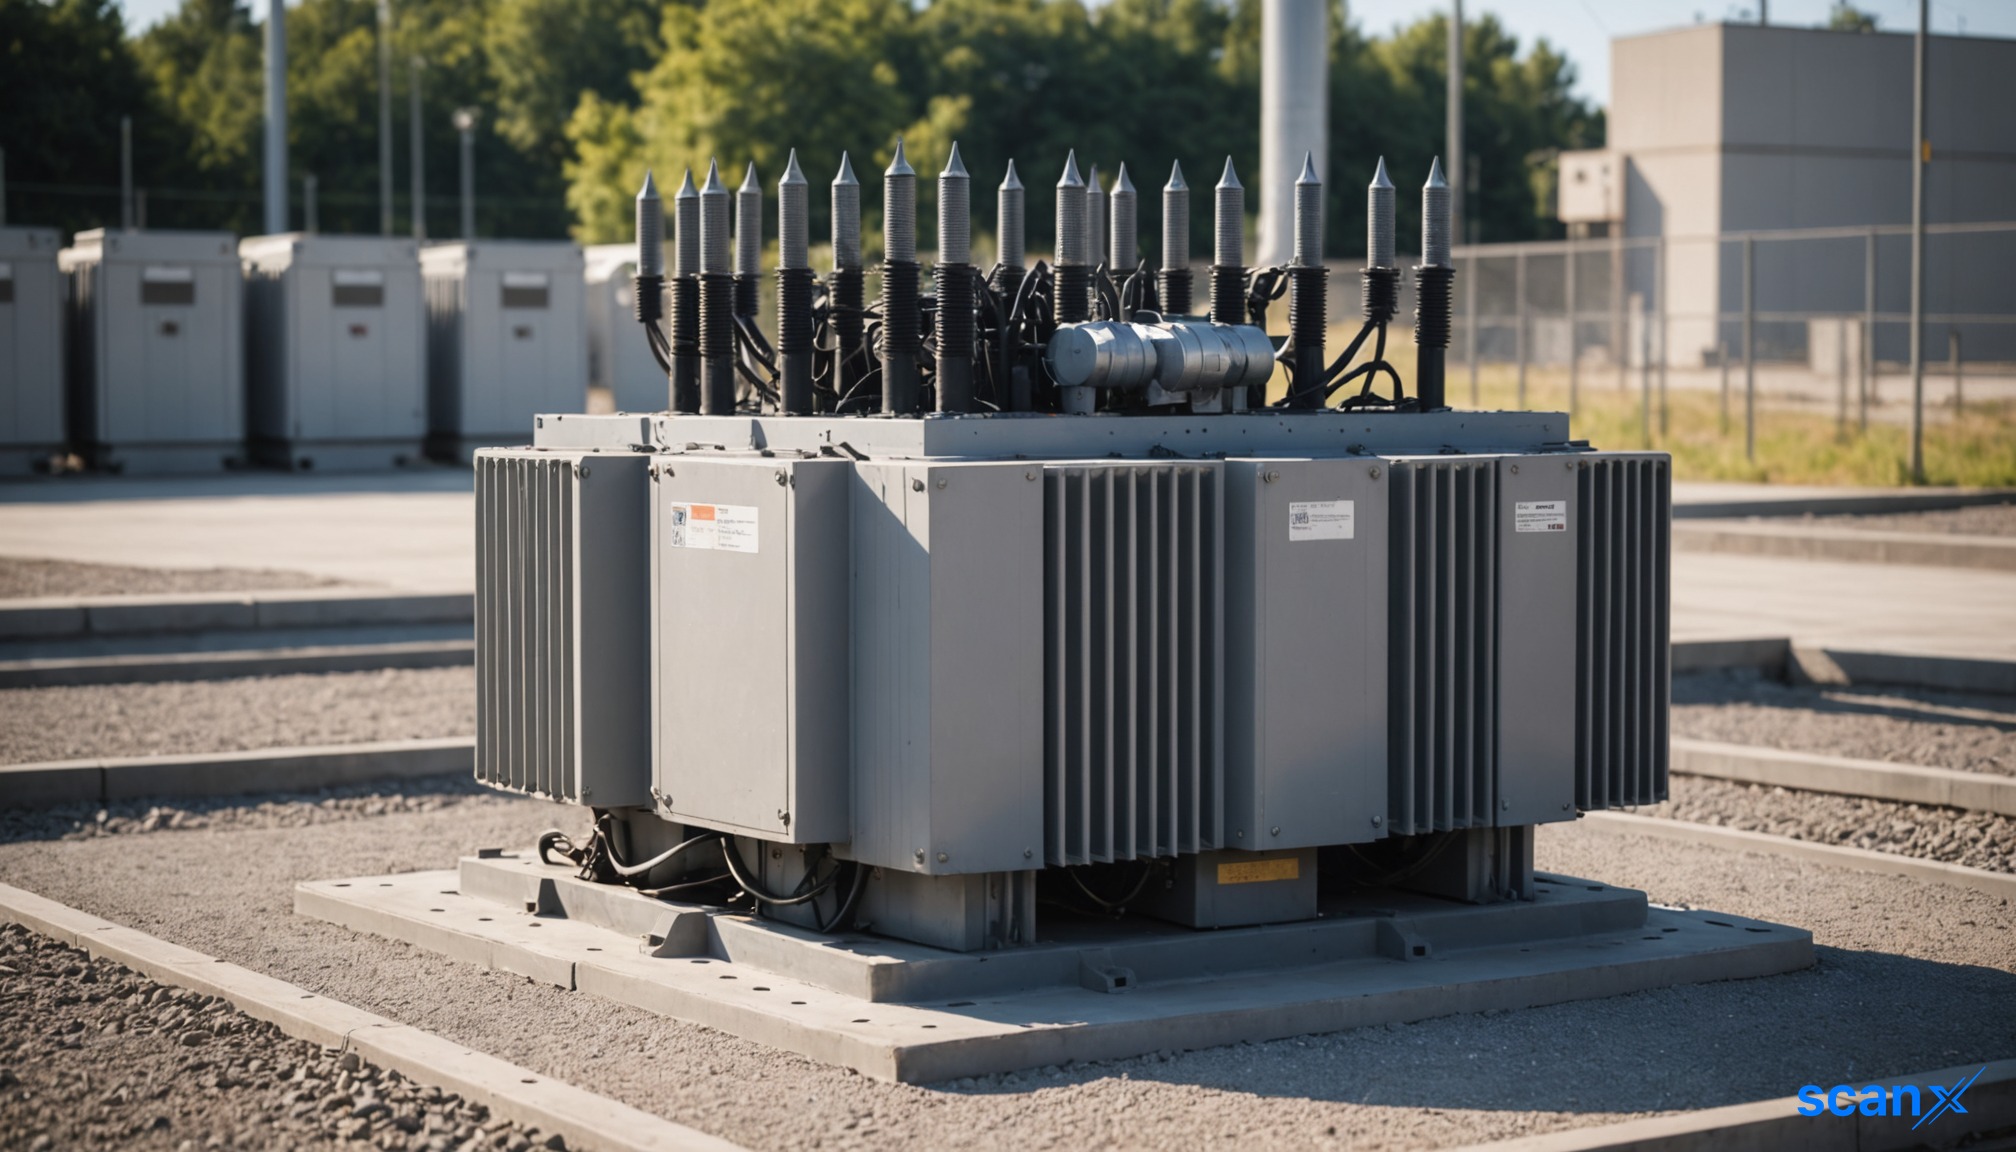

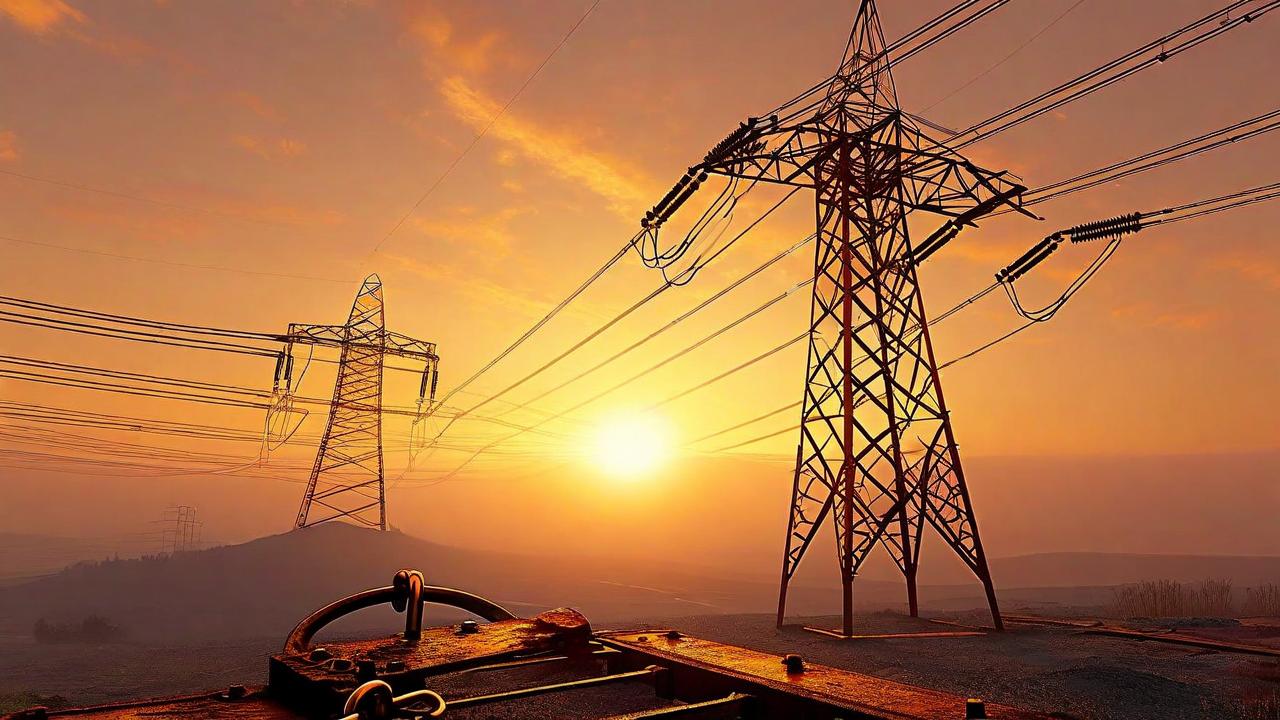
*this image is generated using AI for illustrative purposes only.
GE Vernova T&D India Limited reported a 38% year-on-year revenue increase to ₹18.4 billion in Q1FY27, driven by strong domestic execution and margin expansion. Profit before tax rose 25% to ₹4.9 billion, reflecting operational leverage and improved product mix.
The company generated ₹4.3 billion in cash during the quarter, bringing its available cash balance to ₹29.3 billion. This liquidity supports a committed capex plan of approximately ₹10.1 billion through December 2028.
Financial Performance
Revenue growth was supported by a healthy improvement in product mix, including higher exports and a greater share of private sector customers. EBITDA margins expanded significantly from 3.7% in FY23 to 27.1% in FY26, indicating sustained profitability drivers.
| Metric | Q1FY26 | Q1FY27 | Change |
|---|---|---|---|
| Revenue | ₹13.3 billion | ₹18.4 billion | +38% |
| Profit Before Tax | ₹3.9 billion | ₹4.9 billion | +25% |
| Cash Generation | — | ₹4.3 billion | — |
Order Book and Backlog
New orders for Q1FY27 stood at ₹11.4 billion, down 30% from ₹16.2 billion in the prior year period. However, the total order backlog remains robust at ₹209.3 billion as on June 30, 2026, compared to ₹214.6 billion at the end of March 2026. This backlog provides visibility for future revenue conversion.
Capital Allocation
The company maintains a debt-free balance sheet. Management has proposed a dividend of ₹2.6 billion for FY26, representing a payout ratio of 20.8%. After accounting for committed capex and dividends, an available cash balance of ₹12.3 billion remains for working capital and further expansion.
What the Numbers Show
The divergence between declining new order intake (-30%) and surging revenue (+38%) highlights the company’s ability to convert existing backlog into immediate top-line growth. With margins expanding to 27.1% in FY26, the current revenue scale is generating disproportionate profit growth relative to order volume fluctuations, underscoring the impact of operating leverage and execution efficiencies.
Historical Stock Returns for GE Vernova T&D
| 1 Day | 5 Days | 1 Month | 6 Months | 1 Year | 5 Years |
|---|---|---|---|---|---|
| -0.13% | -1.38% | -11.70% | +12.60% | +37.05% | +3,099.39% |

How will the 30% decline in new order intake impact revenue growth sustainability once the current ₹209.3 billion backlog is converted?
What specific strategies is GE Vernova T&D India employing to maintain its 27.1% EBITDA margin amidst potential supply chain inflation or competitive pricing pressures?
Given the debt-free status and strong cash reserves, are there plans for strategic acquisitions or organic capacity expansion beyond the committed ₹10.1 billion capex through 2028?
 19
19









 Access 50+ Readymade Screeners
  Use 200+ Custom Filters
  Get Full Market Insights





