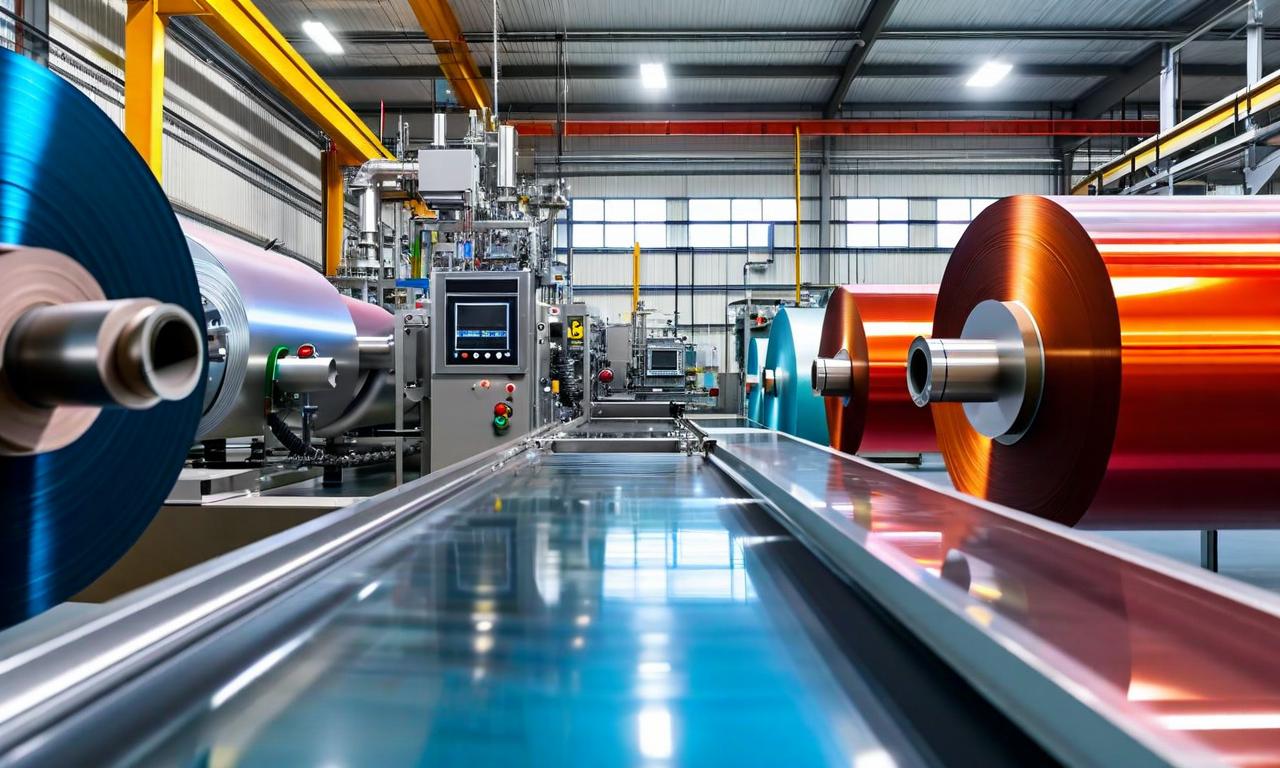
Garware Hi-Tech Films Limited (GHFL) has reported its audited standalone and consolidated financial results for the quarter and year ended March 31, 2026. The board of directors, meeting on May 6, 2026, approved the results and recommended a dividend of Rs. 12 per equity share for the financial year 2025-26, subject to shareholder approval. The company also sanctioned a capital expenditure of Rs. 191 crores for a new Sun Control Film (SCF) line at its Waluj facility, backed by advanced robotics and automation. Pursuant to Regulation 30 of the SEBI (Listing Obligations and Disclosure Requirements) Regulations, 2015, the company also filed its Q4 & FY26 Investor Presentation with the exchanges on May 6, 2026.
Q4FY26 and FY26 Financial Performance
GHFL delivered a record-breaking financial performance in Q4FY26, marking one of the strongest quarters in the company's history. Consolidated revenue from operations rose to Rs. 597 crores, up 8.9% year-on-year (YoY) and 30.1% quarter-on-quarter (QoQ). EBITDA expanded to Rs. 157 crores, up 29.0% YoY and 80.5% QoQ, with the EBITDA margin improving to 26.2% from 22.2% in Q4FY25, an expansion of 409 basis points. Profit after tax (PAT) for the quarter surged to Rs. 108 crores, up 39.1% YoY and 94.0% QoQ, with the PAT margin at 18.1%. On a full-year basis, FY26 revenue reached Rs. 2,120 crores — the highest ever — while FY26 PAT stood at Rs. 338 crores, also a record, reflecting sustained operational efficiency amid global volatility and tariff headwinds.
The following table presents the consolidated financial summary for Q4FY26, Q4FY25, Q3FY26, FY26, and FY25:
| Metric: |
Q4 FY26 |
Q4 FY25 |
Y-o-Y% |
Q3 FY26 |
Q-o-Q% |
FY26 |
FY25 |
Y-o-Y% |
| Revenue from Operations (Rs. Cr): |
597 |
548 |
8.9% |
459 |
30.1% |
2,120 |
2,109 |
0.5% |
| EBITDA (Rs. Cr): |
157 |
121 |
29.0% |
87 |
80.5% |
500 |
495 |
0.8% |
| EBITDA Margin (%): |
26.2% |
22.2% |
+409 bps |
18.9% |
+733 bps |
23.6% |
23.5% |
+7 bps |
| PBT (Rs. Cr): |
142 |
109 |
30.8% |
73 |
94.8% |
446 |
445 |
0.2% |
| PBT Margin (%): |
23.9% |
19.9% |
+400 bps |
15.9% |
+793 bps |
21.0% |
21.1% |
-7 bps |
| Cash Profit (Rs. Cr): |
119 |
93 |
27.4% |
69 |
72.5% |
389 |
377 |
3.1% |
| PAT (Rs. Cr): |
108 |
78 |
39.1% |
56 |
94.0% |
338 |
331 |
2.1% |
| PAT Margin (%): |
18.1% |
14.2% |
+394 bps |
12.2% |
+598 bps |
16.0% |
15.7% |
+25 bps |
| EPS (₹): |
47 |
33 |
39.1% |
24 |
94.0% |
146 |
143 |
2.1% |
Historical Performance and Key Financial Metrics
The investor presentation provides a multi-year view of GHFL's consolidated annual performance, underscoring the company's consistent financial trajectory. Revenue grew from Rs. 1,303 crores in FY22 to Rs. 2,120 crores in FY26, representing a revenue CAGR of 17% over FY21–FY26. EBITDA improved from Rs. 277 crores in FY22 to Rs. 500 crores in FY26, with margins expanding from 21.3% to 23.6% over the same period. PAT grew from Rs. 167 crores in FY22 to Rs. 338 crores in FY26, with PAT margins rising from 12.8% to 16.0%. The company maintained a net-zero debt position since FY24, with cash, bank, and liquid funds standing at Rs. 774 crores as of March 31, 2026, up from Rs. 650 crores in FY25.
The following table summarises key annual financial and operational metrics:
| Metric: |
FY22 |
FY23 |
FY24 |
FY25 |
FY26 |
| Revenue from Operations (₹ Cr): |
1,303 |
1,438 |
1,677 |
2,109 |
2,120 |
| EBITDA (₹ Cr): |
277 |
269 |
321 |
495 |
500 |
| EBITDA Margin (%): |
21.3% |
18.7% |
19.1% |
23.5% |
23.6% |
| PAT (₹ Cr): |
167 |
166 |
203 |
331 |
338 |
| PAT Margin (%): |
12.8% |
11.6% |
12.1% |
15.7% |
16.0% |
| ROCE (%): |
22.5% |
19.5% |
21.1% |
27.2% |
23.3% |
| ROE (%): |
17.7% |
15.2% |
15.9% |
20.6% |
17.9% |
| Current Ratio (x): |
4.4 |
3.8 |
3.5 |
4.3 |
4.4 |
| Cash & Liquid Funds (₹ Cr): |
308 |
387 |
388 |
650 |
774 |
| Gross Debt (₹ Cr): |
182 |
141 |
0 |
0 |
0 |
The EBITDA bridge for Q4FY26 shows that EBITDA improved from Rs. 121.4 crores in Q4FY25 to Rs. 156.6 crores in Q4FY26, driven by higher operating profit of Rs. 165.1 crores (including other income of Rs. 4.2 crores), partially offset by higher employee costs of Rs. 1.0 crore and other expenses of Rs. 17.7 crores, while sales and marketing contributed a positive Rs. 6.2 crores. For the full year, the FY26 EBITDA bridge shows improvement from Rs. 495.5 crores in FY25 to Rs. 499.6 crores in FY26, with operating profit at Rs. 505.9 crores after adding other income of Rs. 10.4 crores, offset by employee cost increases of Rs. 16.3 crores and other expenses of Rs. 27.8 crores, with sales and marketing adding Rs. 3.8 crores.
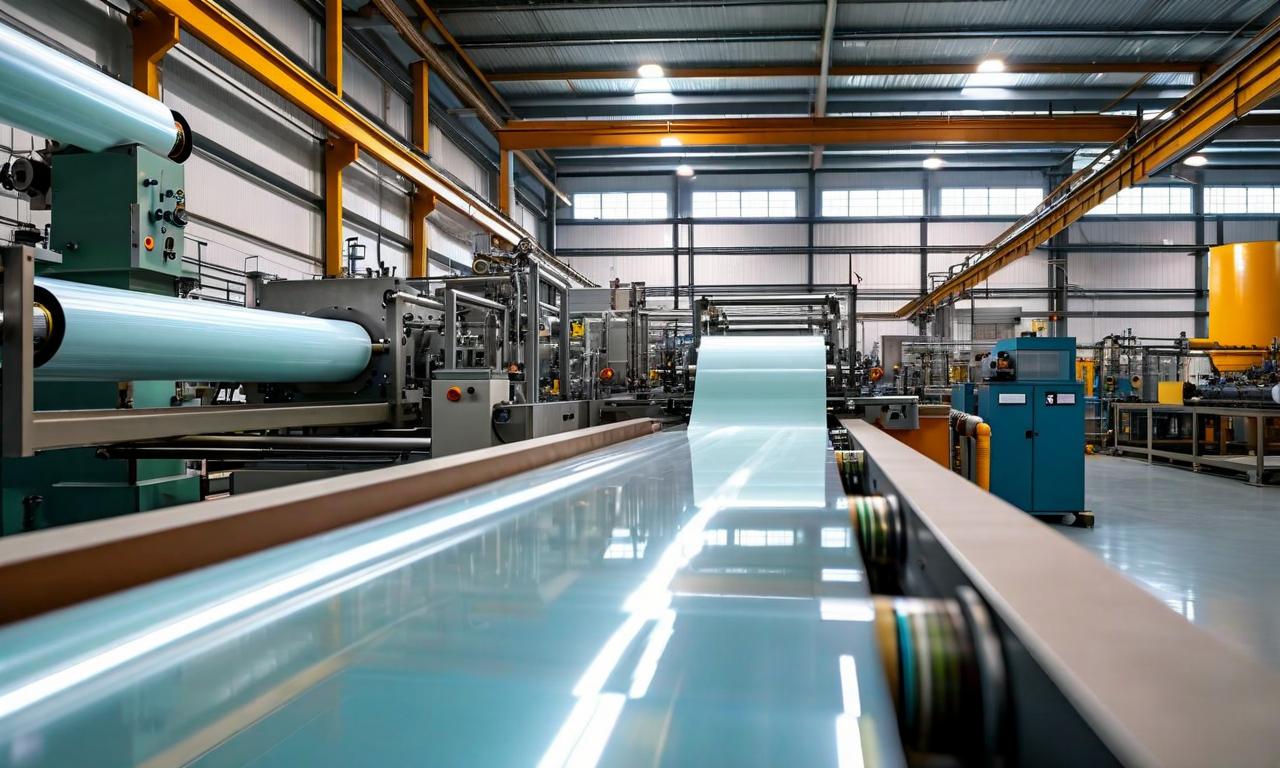
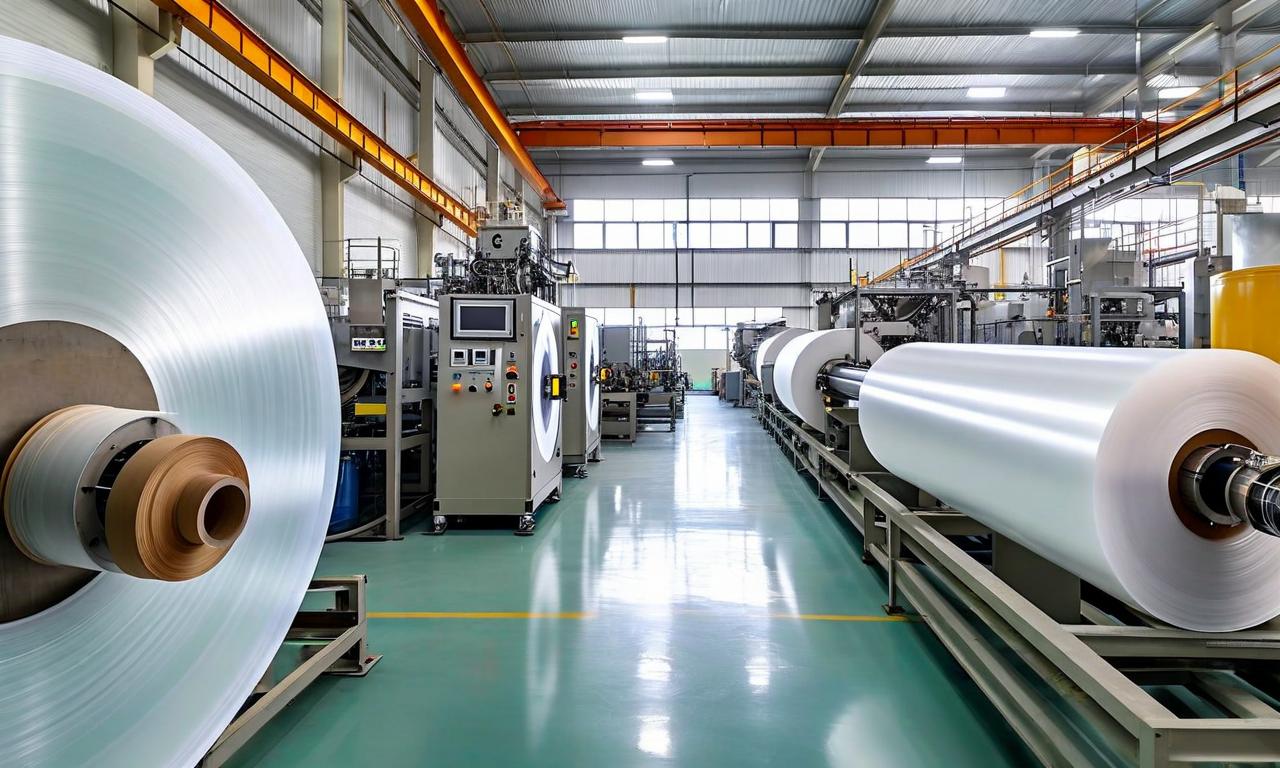
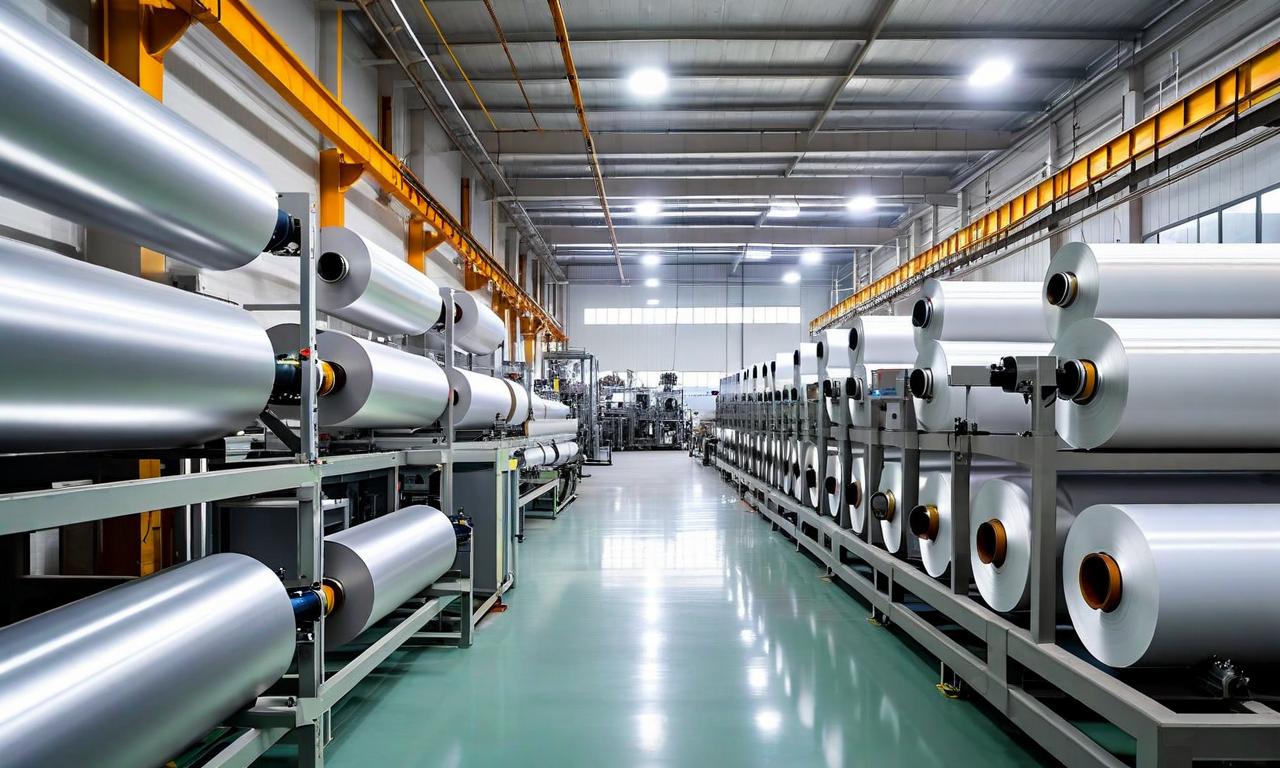
Capital Expansion and Strategic Initiatives
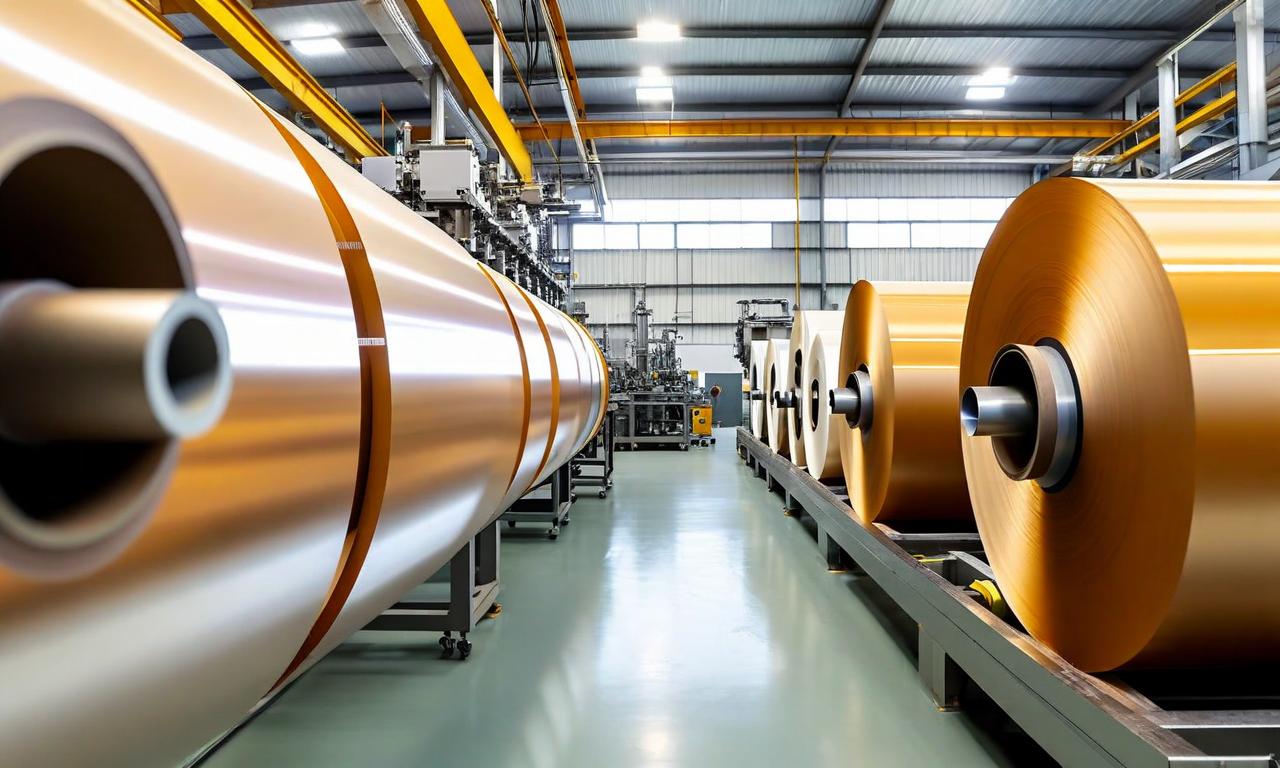
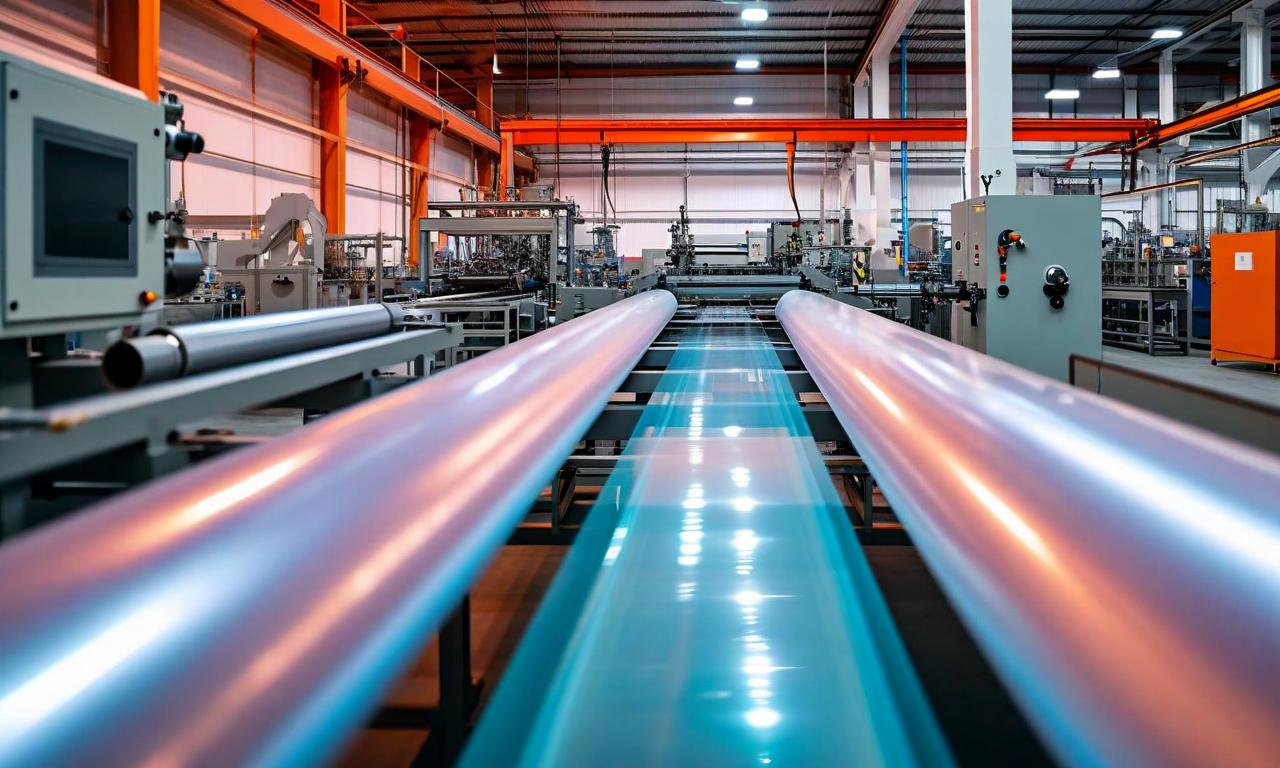
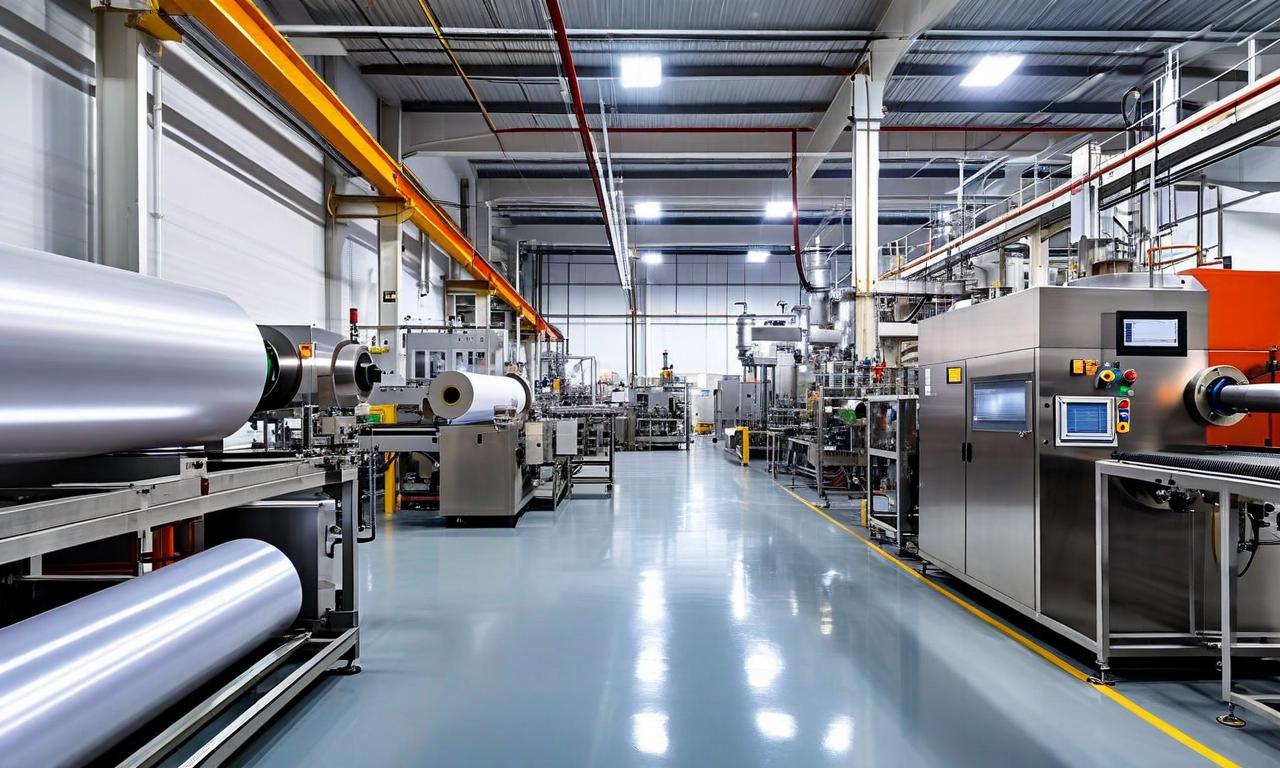
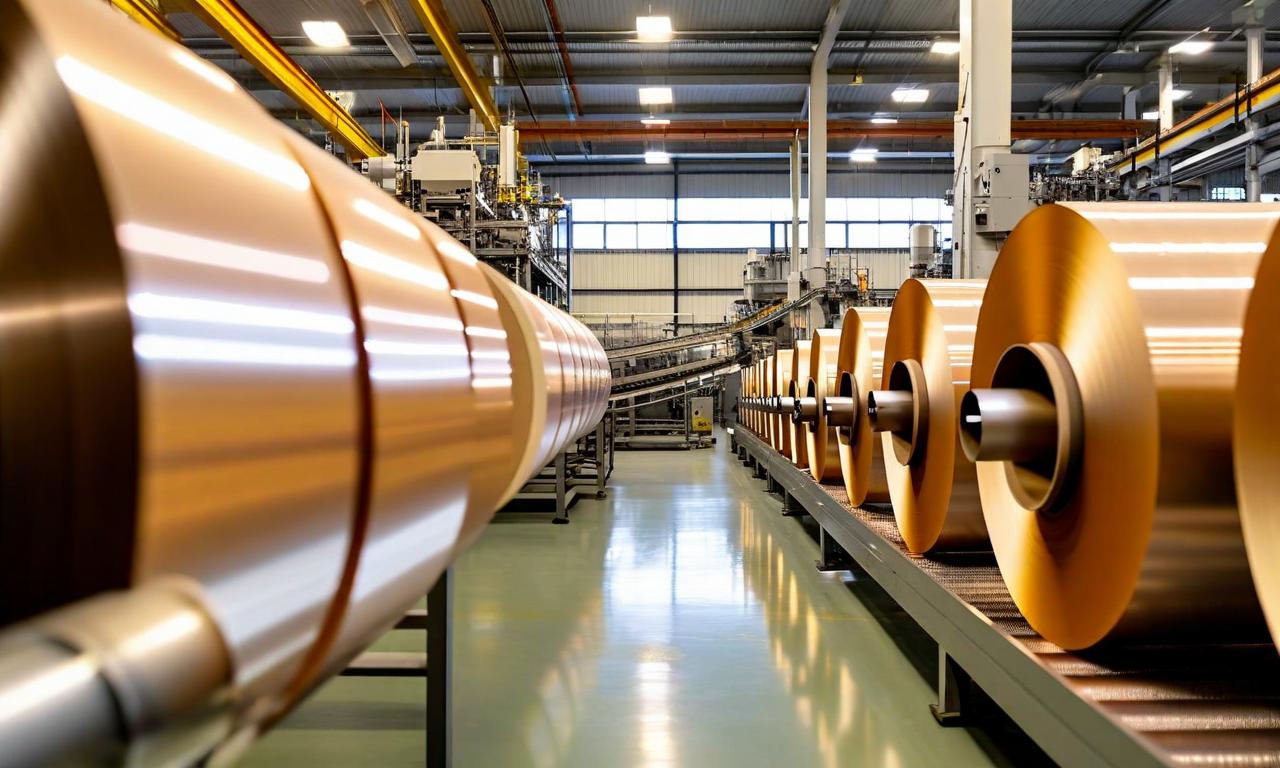
To support future growth, the board approved the addition of a new SCF line with a capacity of approximately 1,200 LSF per annum at Waluj, Chhatrapati Sambhaji Nagar, marking the company's sixth major capital expenditure in recent years. The project is valued at Rs. 191 crores plus applicable taxes, with expected commercial production in June 2027 (Q1FY28). Cumulatively, GHFL has deployed approximately ₹700 crores in capex towards capacity expansion across 2 PPF lines, 2 SCF lines, 1 Metalizer line, 1 TPU line, and ancillary lines, all financed via internal accruals. As of FY26, installed capacity stands at 42,000 MT per annum for the Industrial Products Division (IPD), 4,200 LSF for SCF, and 600 LSF for PPF. On the product innovation front, GHFL unveiled three new products, including sustainable TPU-based UV printable films for complex applications, PDLC specialty films (Privacy on Demand), and Graphic Solutions. The company also expanded its Global Application Studios (GAS) footprint with 11 international additions — 2 in the UAE and 9 in the USA — while its domestic network grew to 250+ Garware Application Studios and 6 Global Home Solutions (GHS) outlets across India, with a target to scale GHS to 50 by the end of FY27. GHFL was also conferred the PLEX Council Highest Exporter Award and recognized among India's top value creators by Dun & Bradstreet.
The following table presents key capacity and capex milestones from the investor presentation:
| Milestone: |
Details |
| PPF Capacity Doubled (FY26): |
60 mn sq. ft., commissioned Q2 FY26 |
| TPU Line (Oct '26): |
Estimated capex of ₹118 Cr, 360 LSF p.a. capacity |
| SCF Line (June 2028): |
Estimated capex of ₹192 Cr, 1,200 LSF p.a. capacity |
| Total Capex Deployed (FY21–FY26): |
~₹700 Cr across 6 major lines |
| Liquidity Surplus (Mar 2026): |
₹774 Cr |
| Gross Debt: |
Zero |
Management Commentary
Commenting on the results, Dr. S. B. Garware, Chairman and Managing Director, stated: "Garware Hi-Tech Films' performance reflects the resilience, strength, and strategic clarity of a business built over more than three decades."
Ms. Monika Garware, Vice Chairperson and Joint Managing Director, added: "We recorded the highest ever quarterly profitability in our history, along with achieving the highest-ever full-year Revenue and PAT since inception, reflecting strong execution and operating discipline. This performance was achieved in an extremely challenging external environment thereby reflecting the strength of our operations and market positioning. During the period, we strengthened our customer first approach through new product launches and the expansion of Garware & Global Application Studios as well as Garware Home Solutions. The newly announced Sun Control Film line will strengthen our future growth."
Board Decisions and Appointments
During the meeting, the board approved the re-appointment of M/s. Deloitte Touche Tohmatsu India LLP as the Internal Auditor and M/s. B. R. Chandak & Co. as the Cost Auditor for FY27. Ms. Sonali Rajesh Mehta was appointed as an Additional Director (Independent) effective June 25, 2026. The board also recommended the re-appointment of Ms. Monika Garware as Vice-Chairperson and Joint Managing Director for a period of five years from November 1, 2026, to October 31, 2031, subject to shareholder approval.
FY27 Business Outlook
Building on the strong performance in FY26, management has provided guidance for FY27. The company targets revenue growth of 15-20%, supported by an export-led strategy and a focus on value-added products. The EBITDA margin is expected to be in the range of 22-25%, with exports contributing over 70% to total revenue and Value-Added Products (VAP) accounting for more than 85%.
| Guidance Parameter: |
FY27 Target |
| Revenue Growth: |
15-20% |
| EBITDA Margin: |
22-25% |
| Revenue from Exports: |
Over 70% |
| VAP Contribution: |
85%+ |
Source: None/Company/INE291A01017/c7877ffe-5fe9-446e-a5d1-41c4e891cc60.pdf


 20
20