

Fujiyama Power Systems Q1FY27 Results: Revenue surges 125%, normalized PAT up 144%


- Revenue surged 125% YoY to ₹13,457 million in Q1FY27
- Normalized PAT grew 144.5% to ₹1,652 million, excluding fire-related provisions
- Full-year guidance upgraded from 50% to 70% growth
- EBITDA margin expanded to 18.9% from 17.7% in Q1FY26
- Distribution network crossed 10,100 partners with new state coverage


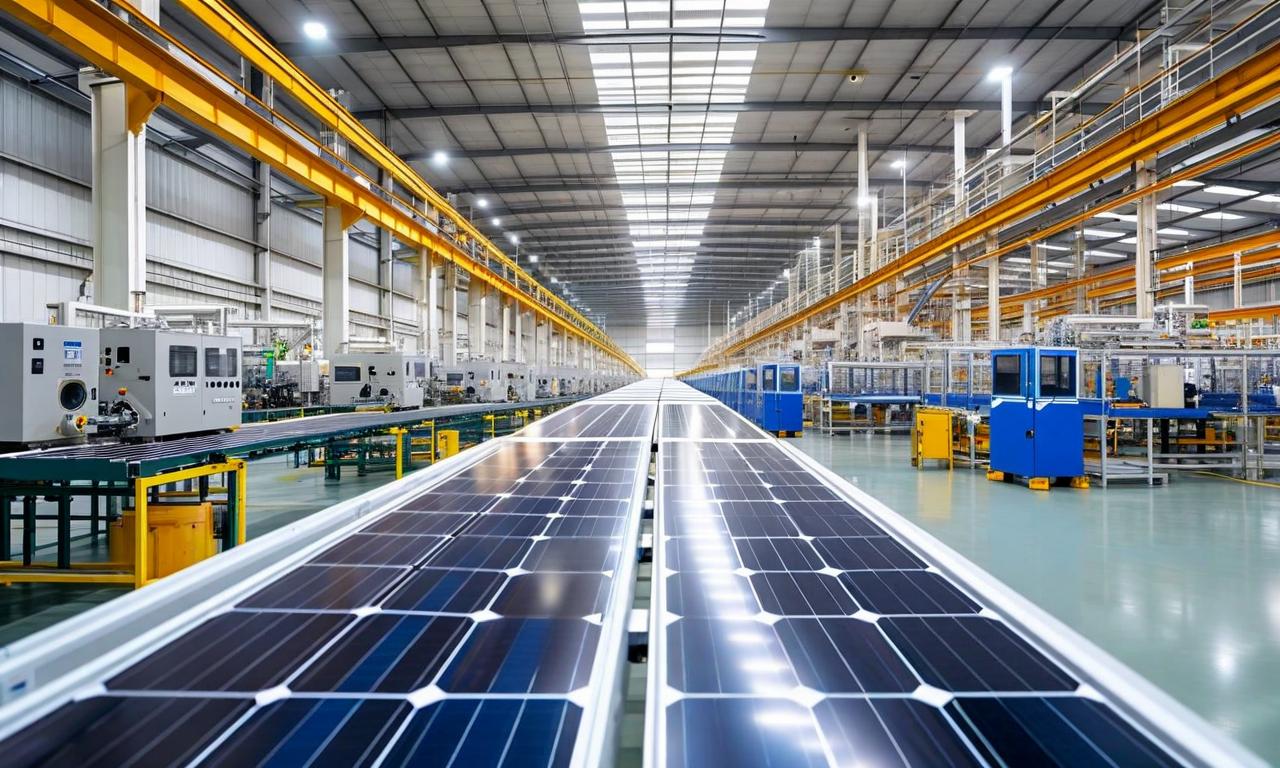
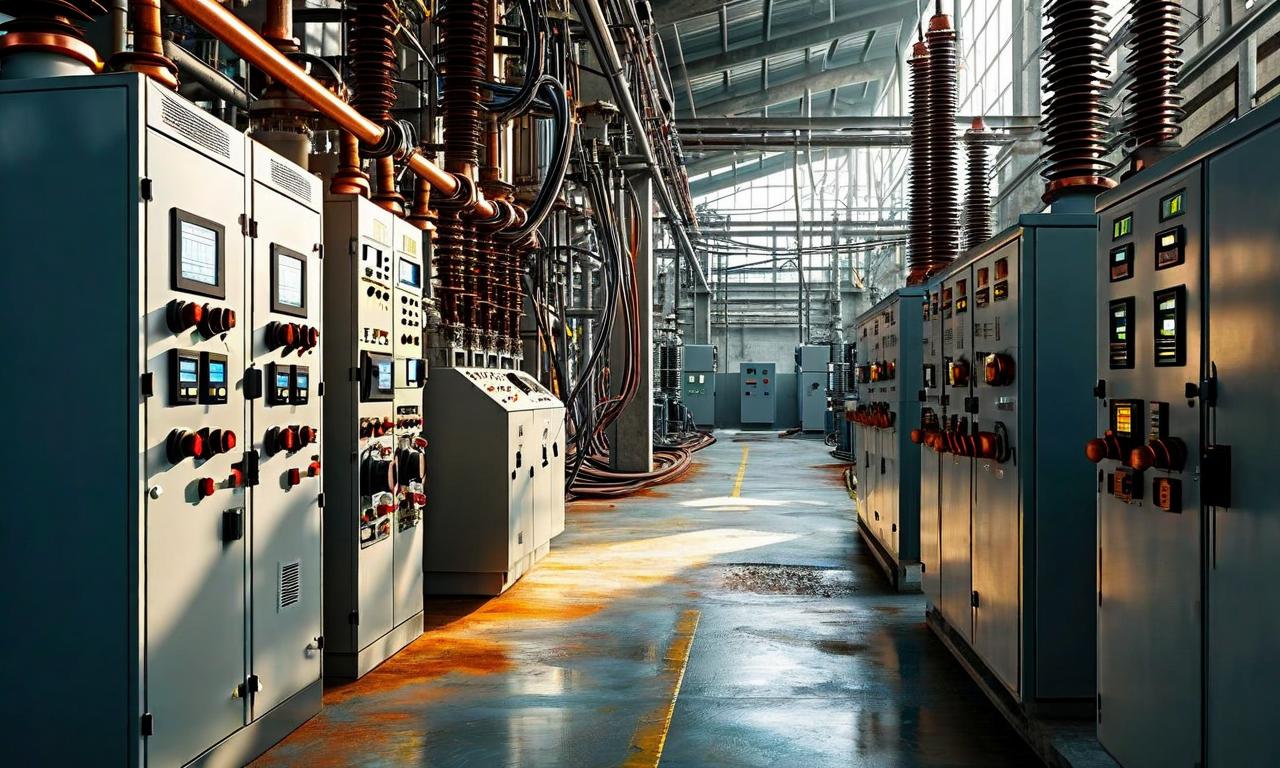
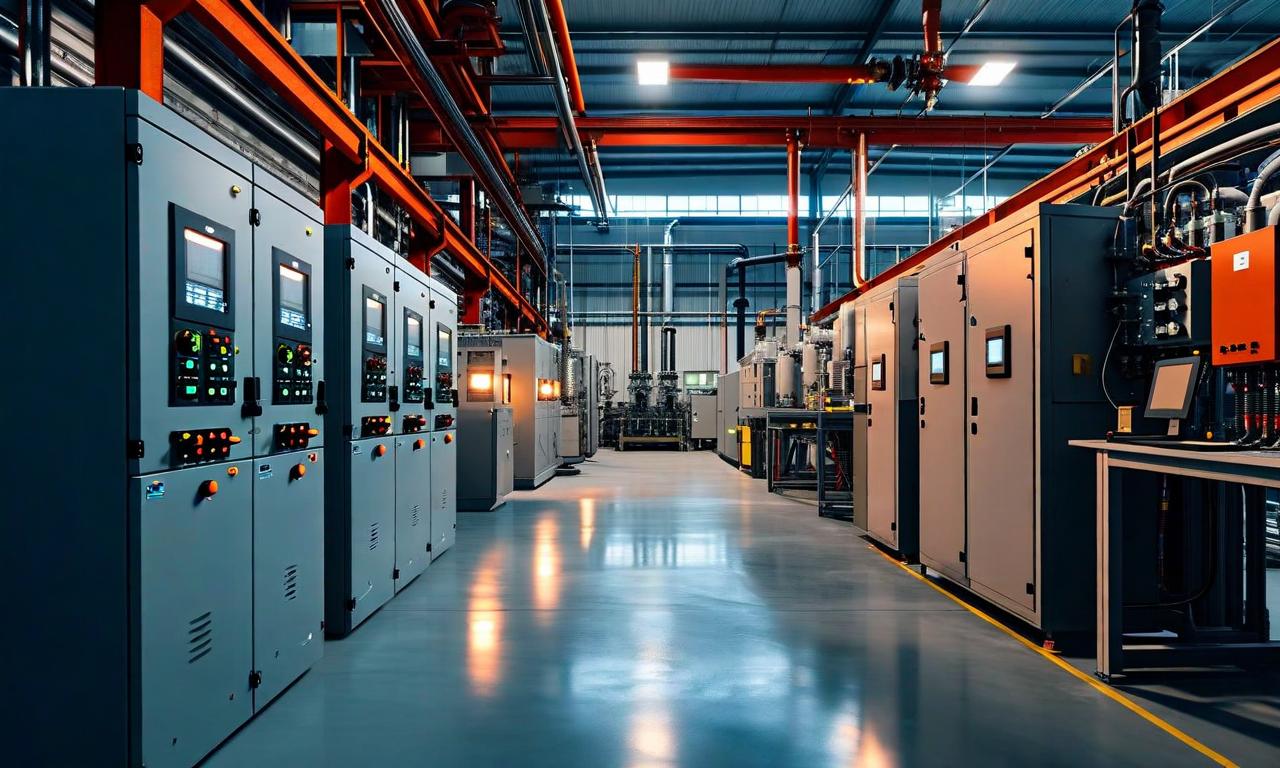
*this image is generated using AI for illustrative purposes only.
Fujiyama Power Systems reported a significant expansion in its financial scale for the quarter ended June 30, 2026. Revenue from operations grew 125% year-on-year to ₹13,457 million, while normalized profit after tax (PAT) increased by 144.5% to ₹1,652 million.
The company revised its full-year growth guidance upward from 50% to 70%, citing robust demand and expanded manufacturing capabilities. This upgrade reflects management's confidence in sustaining momentum through its integrated solar solution portfolio.
Financial Performance
The quarter saw substantial improvement in operating profitability alongside top-line growth. EBITDA rose 140.6% year-on-year to ₹2,548 million, with the margin expanding to 18.9% from 17.7% in the corresponding period of the previous fiscal year.
| Metric | Q1FY27 | Q1FY26 | Change |
|---|---|---|---|
| Revenue | ₹13,457 million | ₹5,973 million | +125.3% |
| EBITDA | ₹2,548 million | ₹1,059 million | +140.6% |
| EBITDA Margin | 18.9% | 17.7% | +120 bps |
| Reported PAT | ₹578 million | ₹248 million | +133.1% |
| Normalized PAT | ₹1,652 million | ₹676 million | +144.5% |
Reported PAT for the quarter stood at ₹578 million, impacted by an exceptional loss provision of ₹1,436 million related to a fire incident at the Bawal facility. Management expects full recovery of this amount through insurance claims, which are currently under assessment.
What the Numbers Show
The divergence between reported and normalized profit highlights the impact of non-recurring events on the bottom line. While reported PAT margins appeared compressed at 4.3%, the underlying operational health is reflected in the normalized PAT margin of 12.3%. This suggests that core business efficiency improved significantly, driven by better absorption of fixed costs across higher volumes rather than pricing power alone.
Capacity and Integration
Manufacturing capacity additions played a pivotal role in supporting revenue growth. The company commissioned a 2-gigawatt solar panel facility at Ratlam, bringing total panel capacity to 3.5 gigawatts. Additionally, a 2-gigawatt power electronics facility was commissioned in August 2026, increasing total power electronics capacity to 4 gigawatts.
Backward integration efforts continued with the increase of stake in Zayo Energy Private Limited and Zayo Cable Private Limited from 19% to 50%. These entities manufacture critical components such as aluminum frames, PV ribbon wires, and solar cables. The company anticipates these investments will enhance supply chain control and potentially improve margins as production scales up next year.
Distribution Network Expansion
The distribution network witnessed one of its largest quarterly expansions, adding over 80 distributors, 1,000 dealers, and 30 exclusive shops. The total channel partner network now exceeds 10,100 partners. Two new states, Odisha and Uttarakhand, were added to the covered category, defined as having at least one distributor per district.
Management targets expanding this network to over 15,000 partners by the end of FY28. This aggressive expansion aims to capitalize on the PM Surya Ghar Muft Bijli Yojana, which has already seen 50 lakh households covered out of a target of 1 crore.
Outlook and Guidance
Looking ahead, the company plans to maintain operating discipline while scaling newly commissioned capacities. The focus remains on the residential rooftop solar segment, which contributes approximately 90% of revenue. With the government targeting 300 gigawatts of solar capacity by 2030, including 90-100 gigawatts from rooftop installations, the addressable market remains substantial.
Capex for the current financial year is expected to reach ₹1,300 crore cumulatively, funded through a mix of debt and internal accruals without equity dilution. The company continues to monitor policy developments regarding PM Surya Ghar 2.0, which may include battery storage incentives.
Historical Stock Returns for Fujiyama Power Systems
| 1 Day | 5 Days | 1 Month | 6 Months | 1 Year | 5 Years |
|---|---|---|---|---|---|
| -2.03% | -2.29% | -10.07% | +81.86% | +93.20% | +93.20% |

How might the pending insurance claim resolution for the Bawal fire incident impact Fujiyama's cash flow and balance sheet in the upcoming quarters?
What specific margin expansion targets does management expect from the increased stake in Zayo Energy and Zayo Cable as production scales up next year?
Could the aggressive expansion of the distribution network to 15,000 partners by FY28 lead to channel inventory buildup or pricing pressure in the residential rooftop segment?
 16
16










 Access Market Heat-map & Insights
  Create, Save & Share your Screener
  Use 200+ Screening Filters





