

Captain Pipes Q1 Results: Consolidated Net Profit Rises 50% YoY


Captain Pipes Limited reported Q1FY26 consolidated revenue of ₹2,368.06 lakh, a 13% YoY increase, but net profit fell to ₹74.67 lakh from ₹148.53 lakh due to higher inventory costs and finance expenses. Associate contribution remained strong.


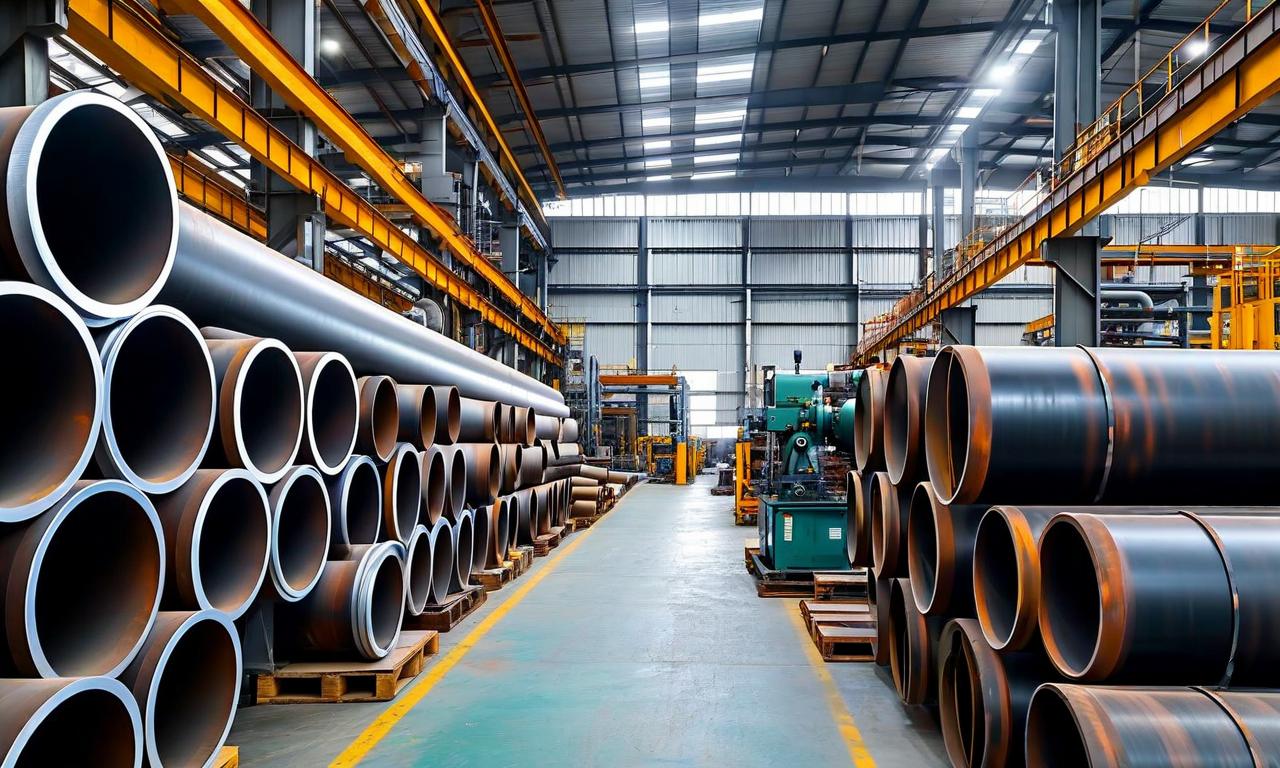
*this image is generated using AI for illustrative purposes only.
Captain Pipes Limited reported a 13% year-on-year increase in revenue to ₹2,368.06 lakh for the first quarter of FY26, while its consolidated net profit declined to ₹74.67 lakh from ₹148.53 lakh in the corresponding period of FY25. The Board of Directors approved the unaudited standalone and consolidated financial results for the quarter ended June 30, 2026, on August 8, 2026. The company operates in the manufacturing and selling of uPVC pipes and fittings segment.
The financial results were reviewed by the Audit Committee and approved by the Board in a meeting held at the company’s registered office in Shapar, Rajkot. Statutory auditor J C Ranpura & Co., Chartered Accountants, issued a limited review report on the results pursuant to Regulation 33 of the SEBI (Listing Obligations and Disclosure Requirements) Regulations, 2015. The report confirms that nothing has come to their attention to suggest the statements contain material misstatement.
Financial Performance Highlights
Revenue from operations rose to ₹2,368.06 lakh in Q1FY26, compared to ₹2,094.36 lakh in Q1FY25. However, the growth in revenue was outpaced by an increase in expenses, leading to a contraction in profitability. Total expenses stood at ₹2,362.52 lakh, up from ₹1,981.24 lakh in the previous year’s quarter.
| Particulars | Q1FY26 (₹ Lakh) | Q1FY25 (₹ Lakh) |
|---|---|---|
| Revenue From Operations | 2,368.06 | 2,094.36 |
| Other Income | 13.59 | 2.94 |
| Total Income | 2,381.65 | 2,097.30 |
| Total Expenses | 2,362.52 | 1,981.24 |
| Profit Before Tax | 88.11 | 177.76 |
| Tax Expense | 13.44 | 29.23 |
| Net Profit After Tax | 74.67 | 148.53 |
The share of profit from the associate company, Captain Polyplast Limited, contributed ₹68.98 lakh to the consolidated bottom line, up from ₹61.70 lakh in Q1FY25. This positive contribution from the associate helped cushion the overall decline in consolidated earnings despite operational headwinds in the parent entity.
What the Numbers Show
A significant driver of the profit decline was the change in inventory levels. The cost of changes in inventories of finished goods, stock-in-trade, and work-in-progress increased to ₹114.59 lakh in Q1FY26, compared to ₹17.13 lakh in Q1FY25. This indicates a higher build-up of inventory during the quarter, which directly reduced the profit before tax. Additionally, finance costs rose to ₹68.69 lakh from ₹41.90 lakh in the prior year period, further pressuring margins. While revenue growth demonstrates demand resilience in the uPVC pipe sector, the inability to convert this into proportional profit suggests input cost pressures or working capital inefficiencies that warrant monitoring in subsequent quarters.
Historical Stock Returns for Captain Pipes
| 1 Day | 5 Days | 1 Month | 6 Months | 1 Year | 5 Years |
|---|---|---|---|---|---|
| -0.63% | +1.93% | -6.27% | -29.66% | -40.09% | +465.71% |

What specific operational strategies will Captain Pipes implement to reduce the significant rise in inventory build-up and improve working capital efficiency in Q2FY26?
How does management plan to mitigate the impact of rising finance costs, which increased by over 60% year-on-year, on future profit margins?
Will the company adjust its pricing strategy for uPVC pipes and fittings to offset input cost pressures, or is it expected to absorb these costs to maintain market share?
 16
16







 Create Custom Screeners
  Access 200+ Pre-built Filters
  Use 50+ Readymade Screener





