Cadence Design Systems raises FY26 GAAP EPS to $4.76-$4.86

scanx
Reviewed by
Suketu GScanX News Team
Key Highlights

Cadence Design Systems upgraded its FY26 GAAP EPS guidance to $4.76-$4.86, exceeding the $4.51 estimate. This follows earlier increases in adjusted EPS to $8.05-$8.15 and sales to $6.260B-$6.340B, signaling strong EDA tool demand.

powered bylight_fuzz_icon
46731281

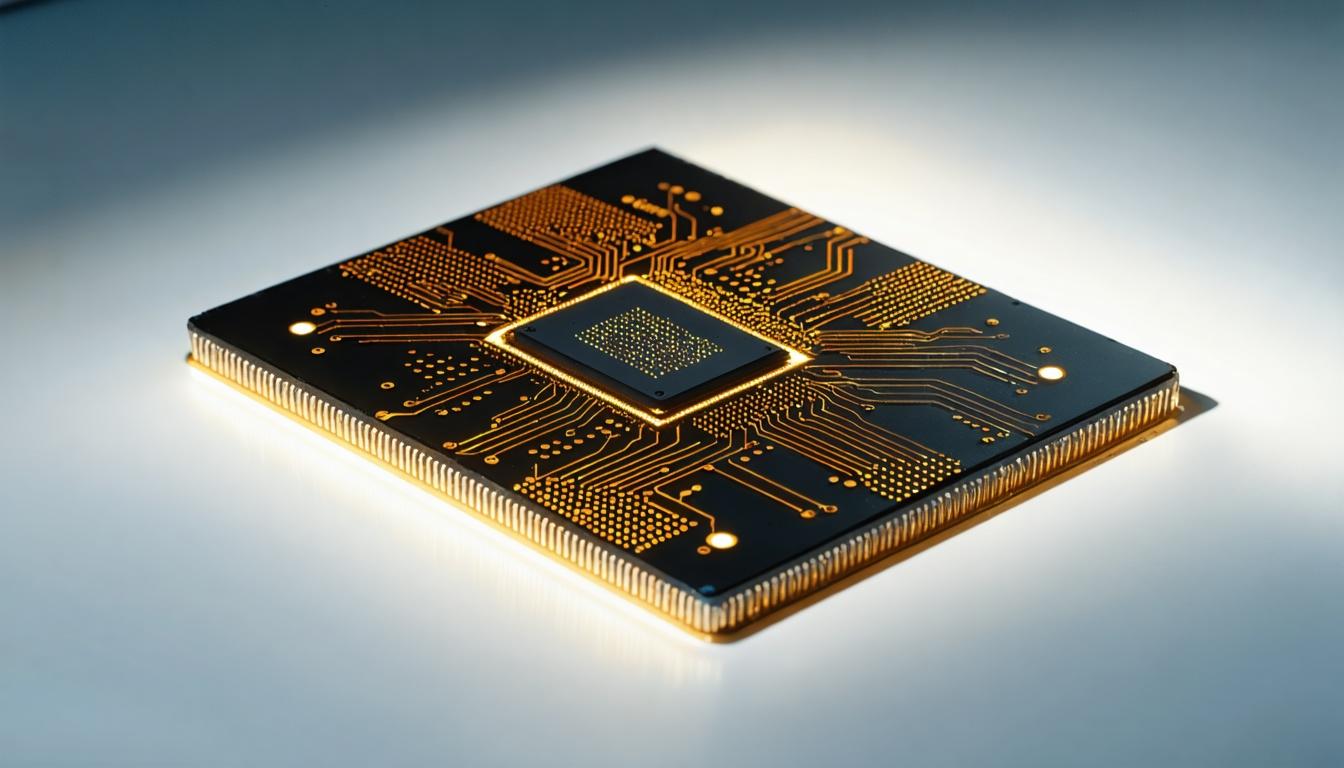
*this image is generated using AI for illustrative purposes only.

Cadence Design Systems (NASDAQ: CDNS) raised its fiscal year 2026 generally accepted accounting principles (GAAP) earnings per share (EPS) guidance from $4.39-$4.49 to $4.76-$4.86, surpassing the $4.51 analyst estimate. This update follows a previous revision where the company lifted its adjusted EPS outlook from $7.85-$7.95 to $8.05-$8.15 and increased full-year sales projections from $6.125 billion-$6.225 billion to $6.260 billion-$6.340 billion.

The dual upgrade across both GAAP and adjusted metrics signals robust demand for its electronic design automation (EDA) tools and digital sign-off solutions. By exceeding market consensus on multiple fronts, Cadence demonstrates strong operational momentum in the semiconductor design sector.

Guidance Revisions

Metric Previous Guidance Revised Guidance Analyst Estimate
Adj EPS $7.85 - $7.95 $8.05 - $8.15 $7.96
Sales $6.125B - $6.225B $6.260B - $6.340B $6.207B
GAAP EPS $4.39 - $4.49 $4.76 - $4.86 $4.51

The revised GAAP EPS range now sits entirely above the prior ceiling of $4.49, indicating a significant improvement in profitability outlook after-tax and non-recurring items. Similarly, the adjusted EPS floor of $8.05 exceeds the previous ceiling of $7.95, reflecting broad-based revenue strength.

What the Numbers Show

The simultaneous beat on GAAP EPS, adjusted EPS, and sales estimates suggests operational leverage is intact while revenue growth accelerates. The gap between the revised mid-point of the sales range and the analyst estimate implies that Cadence’s recent performance has outpaced broader market expectations for the semiconductor software industry. The alignment between GAAP and adjusted metric upgrades indicates that core operational efficiency is driving the top-line growth rather than one-time adjustments.

Disclaimer: This article is AI-generated using data from ViewTrade. ScanX is not liable for any inaccuracies.

How might Cadence's revised guidance influence the earnings expectations for its primary competitors, Synopsys and Siemens EDA?

Which specific end-markets, such as AI accelerators or automotive semiconductors, are driving the accelerated demand for Cadence's digital sign-off solutions?

Could the significant gap between Cadence's revised sales midpoint and analyst estimates signal a broader recovery in semiconductor capital expenditures beyond just software tools?

like17
dislike

Cadence Design Systems Q3 adj EPS guidance beats estimates

scanx
Reviewed by
Shriram SScanX News Team
Key Highlights

Cadence Design Systems has issued third-quarter guidance for both adjusted and GAAP earnings per share that exceeds analyst expectations. The adjusted EPS forecast of $2.01-$2.07 beats the $1.94 estimate, while GAAP EPS guidance of $1.11-$1.17 surpasses the $1.106 consensus, reflecting strong operational confidence.

powered bylight_fuzz_icon
46728932

*this image is generated using AI for illustrative purposes only.

Cadence Design Systems (NASDAQ: CDNS) has projected third-quarter adjusted earnings per share (EPS) in the range of $2.01 to $2.07, a forecast that exceeds the prevailing analyst estimate of $1.94. The semiconductor design automation firm also updated its GAAP EPS guidance to $1.11–$1.17, surpassing the $1.106 consensus. This dual beat signals strong profitability and disciplined execution in its core electronic design automation markets.

The company’s financial outlook highlights a clear outperformance against market expectations on both an adjusted and GAAP basis. By setting the midpoint of its adjusted EPS guidance at approximately $2.04, Cadence demonstrates confidence in maintaining margins and managing operational expenses effectively during the period. The upward revision suggests that recent order inflows and customer spending patterns have improved beyond what external models had captured.

Guidance vs. Estimates

The disparity between Cadence’s guidance and analyst estimates indicates that even conservative outcomes will result in positive earnings surprises. The adjusted EPS range provides significant upside relative to the $1.94 consensus, while the GAAP guidance floor of $1.11 sits above the $1.106 estimate.

Metric Analyst Estimate Guidance Low Guidance High
Adjusted EPS $1.94 $2.01 $2.07
GAAP EPS $1.106 $1.11 $1.17

This alignment reduces downside risk for investors while preserving upside potential if revenue growth or cost efficiencies exceed internal projections. The narrow spread between the low end of the GAAP guidance and the estimate suggests high visibility into near-term performance drivers.

What the Numbers Show

The fact that both the adjusted and GAAP guidance ranges sit above analyst estimates is a material indicator of management’s confidence. For a mature technology firm like Cadence, such precision in beating estimates often reflects disciplined expense management and resilient demand for its tools. The stronger-than-anticipated adjusted EPS specifically points to robust core operating performance, excluding one-time items, which reinforces the sustainability of its growth trajectory.

Disclaimer: This article is AI-generated using data from ViewTrade. ScanX is not liable for any inaccuracies.

How might this earnings beat influence Cadence's valuation multiple relative to other semiconductor design automation peers in the coming quarter?

Will management provide specific commentary on the geographic distribution of the recent order inflows that drove this positive revision?

Are there indications that customers are accelerating spending on AI-related EDA tools, contributing to the stronger-than-expected demand?

like18
dislike

More News on Cadence Design Systems Inc