

Borosil Renewables plans 600 TPD capacity expansion to 1,600 TPD


- Borosil Renewables plans to expand solar glass capacity from 1,000 TPD to 1,600 TPD by adding two new furnaces by December 2026
- The expansion aims to capture share of the estimated 8,400 TPD supply gap in India's domestic solar glass market
- FY26 turnover stood at ₹1,535 crore, with management projecting ~₹2,500 crore at full-year run rate post-expansion
- The company maintains a strong balance sheet, expecting to remain net cash positive after funding the entire capex for the new capacity

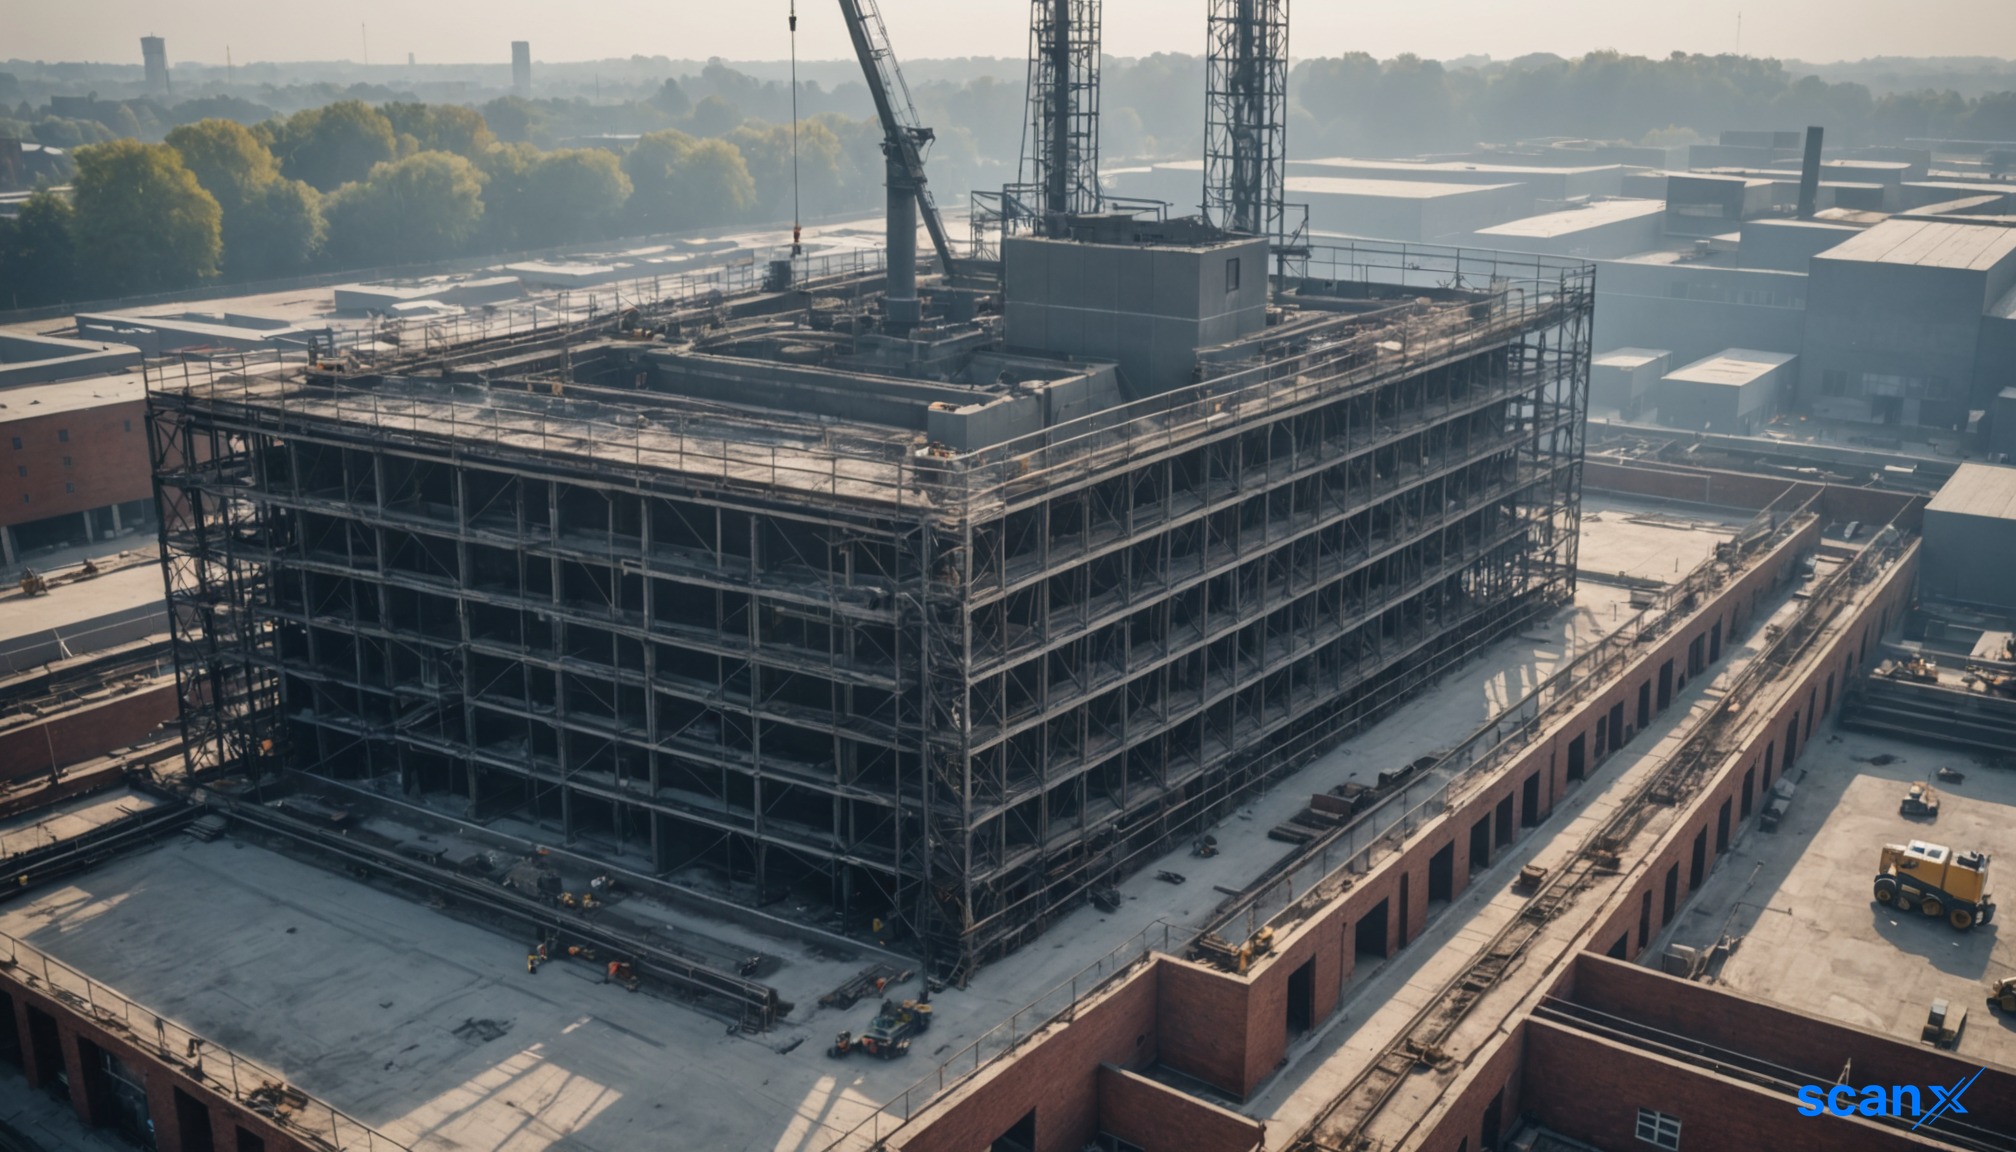

*this image is generated using AI for illustrative purposes only.
Borosil Renewables has outlined a significant capacity expansion plan, aiming to increase its solar glass production capability from the current 1,000 TPD to 1,600 TPD. The company announced that two new furnaces, SG-4 and SG-5, with a combined capacity of 600 TPD, are scheduled for commissioning by December 2026.
Capacity Expansion Strategy
The expansion is designed to address a substantial supply gap in the domestic market. According to the presentation, India’s solar glass demand reached 11,000 TPD (71.5 GW equivalent) in FY26, while domestic capacity stood at just 2,600 TPD (16.9 GW equivalent). This created a supply deficit of 8,400 TPD (54.6 GW equivalent). Even with projected industry-wide growth to 7,900 TPD by March 2027, a significant gap remains, providing a clear runway for Borosil Renewables’ growth.
| Metric | Current Status | Post-Expansion Target |
|---|---|---|
| Total Capacity | 1,000 TPD (~6.5 GW) | 1,600 TPD (~10.5 GW) |
| FY26 Turnover | ₹1,535 crore | ~₹2,500 crore (projected) |
| Operating EBITDA Margin | 30.5% | ~33% (estimated) |
The company expects this scale-up to drive its annual turnover to approximately ₹2,500 crore, representing a roughly 60% increase over FY26 levels. Management projects an operating leverage of approximately 3% in EBITDA margins due to higher scale and efficiencies.
Financial Performance and Balance Sheet
Borosil Renewables reported a turnover of ₹1,535 crore for FY26. Over the period from FY19 to FY26, the company achieved a revenue CAGR of 32.3% and an operating EBITDA CAGR of 45.5%. The net working capital cycle stood at 46 days in FY26.
What the Numbers Show
The divergence between the company’s revenue growth (32.3% CAGR) and its margin expansion (45.5% EBITDA CAGR) indicates improving operational efficiency and pricing power over the seven-year period. Furthermore, the management’s assertion that the company will remain net cash positive even after funding the entire capex for the 600 TPD expansion suggests robust internal cash generation capabilities relative to its capital intensity.
Strategic Initiatives
Beyond capacity expansion, the company is diversifying into end-to-end rooftop solar solutions. This new adjacency involves co-branding and OEM partnerships for panels, inverters, and batteries, targeting residential, commercial, and industrial rooftops in Gujarat, Rajasthan, Uttar Pradesh, West Bengal, and Maharashtra.
Borosil Renewables also highlighted its technological edge, including:
- Development of the world’s first antimony-free textured solar glass.
- Production of fully tempered 2mm textured solar glass with 180 MPa stress endurance, double the European standard of 90 MPa.
- A manufacturing process with a reported 22% lower carbon footprint versus the default glass-manufacturing benchmark.
The company currently serves over 100 domestic customers and has an international presence in Western Europe, Türkiye, and emerging markets in the Americas and MENA.
Historical Stock Returns for Borosil Renewables
| 1 Day | 5 Days | 1 Month | 6 Months | 1 Year | 5 Years |
|---|---|---|---|---|---|
| -1.53% | -1.96% | -5.39% | -13.02% | -35.56% | 0.0% |

How might the commissioning of furnaces SG-4 and SG-5 by December 2026 impact Borosil Renewables' ability to capture market share from imported solar glass amidst India's persistent supply deficit?
What are the potential risks to the projected 33% EBITDA margin if raw material costs for antimony-free glass production rise or if competitive pricing pressures intensify in the domestic market?
How will the company's diversification into rooftop solar solutions and OEM partnerships affect its capital allocation strategy and return on invested capital (ROIC) compared to its core glass manufacturing business?
 17
17








 Access 50+ Readymade Screeners
  Use 200+ Custom Filters
  Get Full Market Insights





