
 NewsBorosil Renewables FY 2025-26 Annual Report: Standalone Revenue Surges 38.28% YoY to ₹1,53,482.50 Lakhs
Borosil Renewables FY 2025-26 Annual Report: Standalone Revenue Surges 38.28% YoY to ₹1,53,482.50 Lakhs


Borosil Renewables' FY 2025-26 Annual Report highlights a strong standalone turnaround with revenue up 38.28% YoY to ₹1,53,482.50 lakhs and EBITDA surging 172.38% to ₹49,167.61 lakhs, driven by anti-dumping duties on solar glass imports. However, exceptional charges of ₹35,977.85 lakhs from the insolvency of German subsidiaries GMB and Geosphere weighed on net profit. On a consolidated basis, revenue rose 5.2% to ₹1,55,583.50 lakhs, while the Company raised ₹37,148.75 lakhs via preferential allotment and commissioned a 16.5 MW wind-solar hybrid plant.


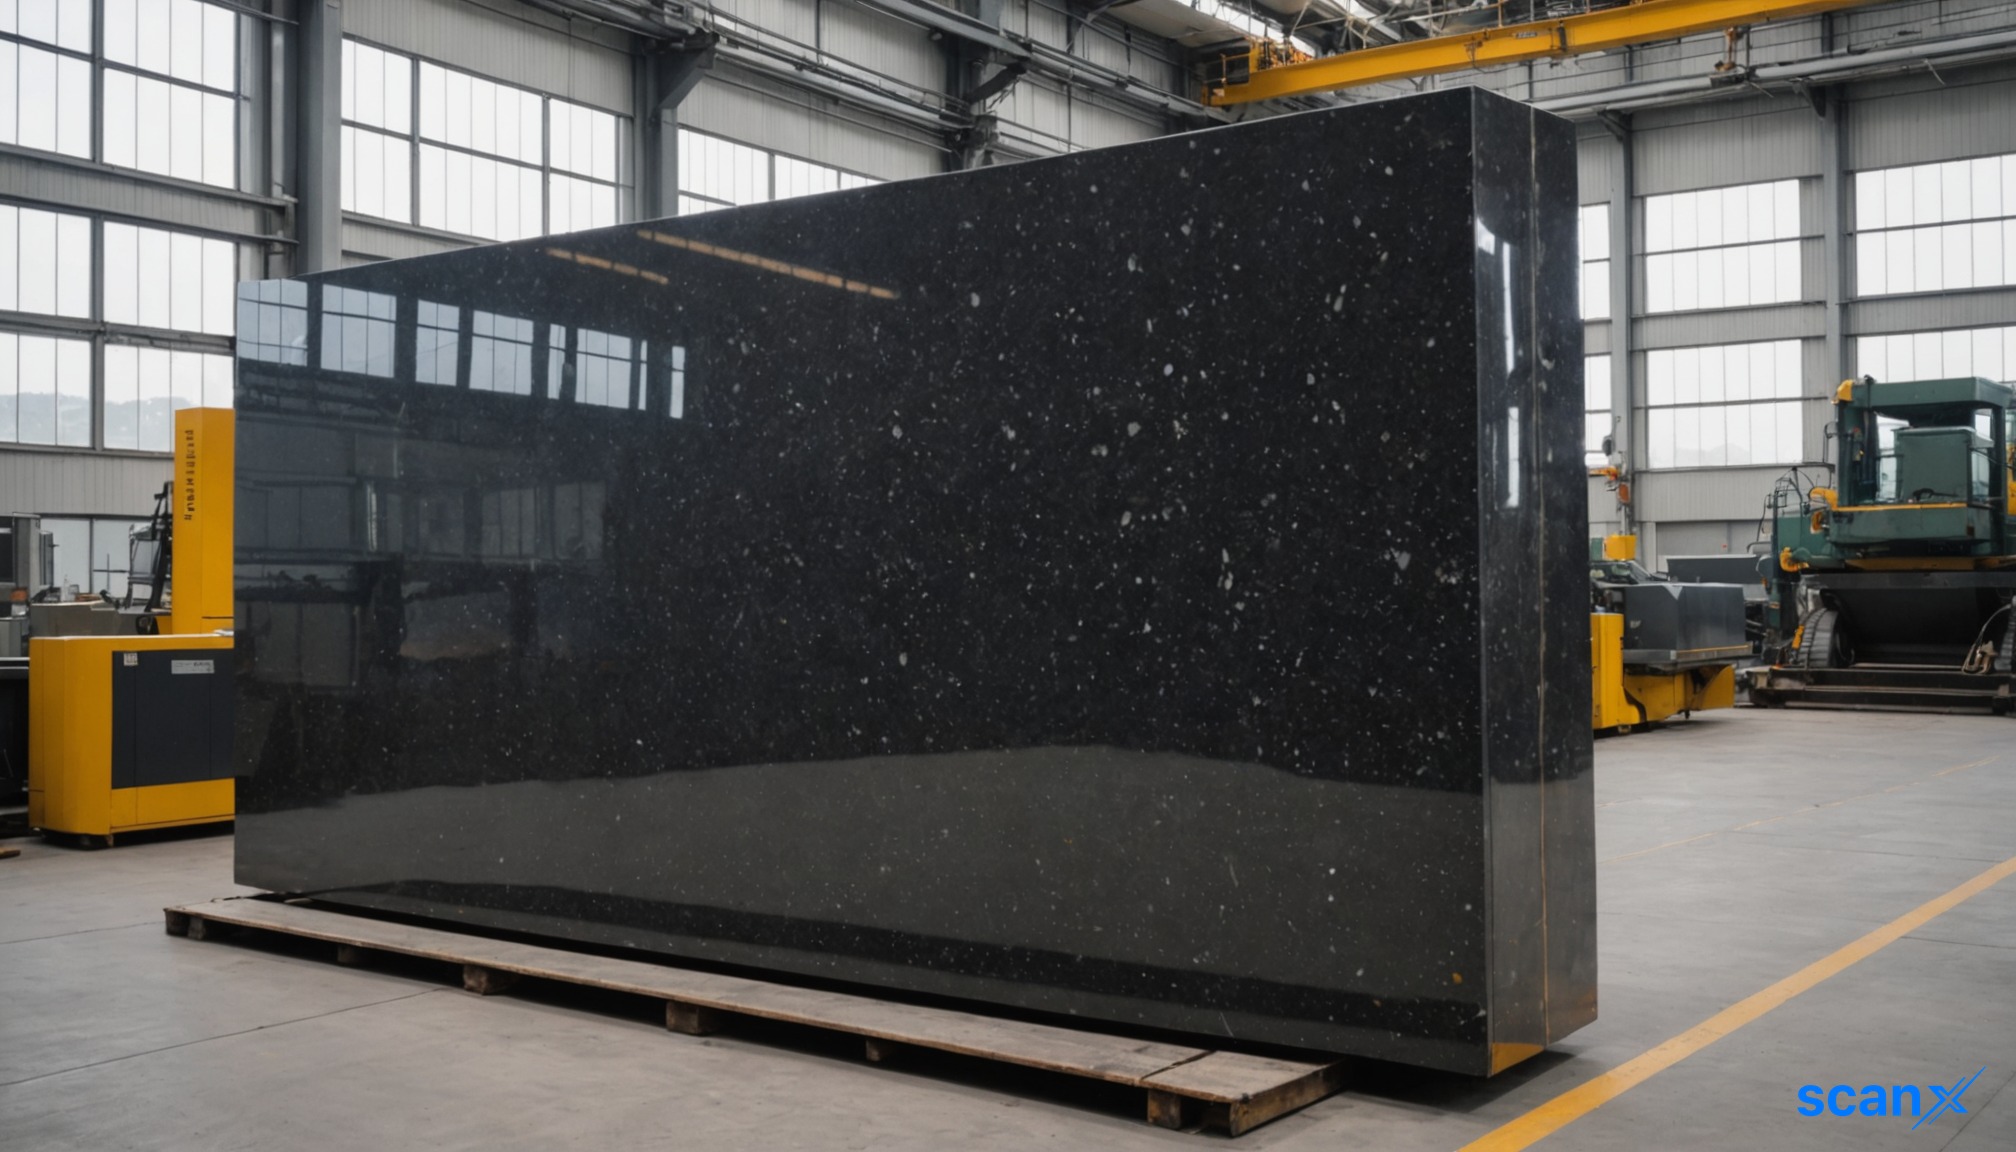
*this image is generated using AI for illustrative purposes only.
Borosil Renewables Limited has released its Annual Report for FY 2025-26, marking a significant operational turnaround on a standalone basis while navigating substantial one-time charges from the insolvency of its German subsidiaries. The Company's 63rd Annual General Meeting is scheduled for Thursday, August 27, 2026, at 11:00 a.m. (IST) through video conferencing.
Standalone Financial Performance
The Company achieved a strong standalone recovery in FY 2025-26, driven by the imposition of provisional anti-dumping duties on solar glass imports from China and Vietnam effective December 4, 2024, a 6% increase in production, and inventory reduction. The following table summarises the key standalone financial metrics:
| Metric: | FY 2025-26 | FY 2024-25 |
|---|---|---|
| Revenue from Operations: | ₹1,53,482.50 lakhs | ₹1,10,993.63 lakhs |
| YoY Growth: | +38.28% | — |
| EBITDA: | ₹49,167.61 lakhs | ₹18,051.26 lakhs |
| EBITDA Growth: | +172.38% | — |
| EBITDA Margin: | 32% of revenue | 16% of revenue |
| Profit Before Tax (before exceptional items): | ₹39,071.24 lakhs | ₹4,685.65 lakhs |
| Exceptional Items: | ₹35,977.85 lakhs | — |
| Profit Before Tax (after exceptional items): | ₹3,093.39 lakhs | ₹4,685.65 lakhs |
| Net Profit After Tax: | ₹2,019.62 lakhs | ₹3,319.02 lakhs |
| Average Ex-factory Selling Price: | ₹146.7/mm | ₹113.4/mm |
Exports amounted to ₹11,328.95 lakhs, accounting for 7.38% of turnover, compared to ₹8,711.46 lakhs (7.85% of turnover) in the previous year.
Consolidated Performance
On a consolidated basis, the Group reported a significant improvement in EBITDA despite the closure of overseas operations. Consolidated revenue from operations rose 5.2% to ₹1,55,583.50 lakhs from ₹1,47,932.89 lakhs, while consolidated EBITDA climbed 401.90% to ₹46,596.26 lakhs from ₹9,283.99 lakhs. The table below presents the key consolidated metrics:
| Metric: | FY 2025-26 | FY 2024-25 |
|---|---|---|
| Revenue (₹ in crores): | 1,479.33 | 1,555.84 |
| EBITDA (₹ in crores): | 92.84 | 465.96 |
| EBITDA Margin (%): | 6.30 | 29.95 |
| PAT (₹ in crores): | (86.97) | 127.40 |
| EPS (₹): | (5.32) | 9.48 |
| Interest (₹ in crores): | 31.55 | 14.18 |
| Depreciation (₹ in crores): | 135.42 | 95.39 |
| RoCE (%): | (19) | 21.77 |
| RoE (%): | 7.22 | 10.16 |
Exceptional Items and German Subsidiary Insolvency
The financial year was significantly impacted by exceptional items totalling ₹35,977.85 lakhs on a standalone basis. GMB Glasmanufaktur Brandenburg GmbH filed for insolvency on July 4, 2025, following a complete absence of demand recovery in the European solar glass market. Subsequently, Geosphere Glassworks GmbH filed for voluntary insolvency on December 22, 2025. The Board of Directors decided to write off the entire exposure of ₹32,590.81 lakhs comprising investments, loans (including interest thereon), and other receivables in the German subsidiaries. An additional provision of ₹3,387.04 lakhs was made against the investment in Laxman AG due to impairment in the value of its subsidiary Interfloat Corporation, leaving a balance investment of ₹2,371.82 lakhs. The step-down subsidiaries GMB and Geosphere were deconsolidated from the consolidated financial statements with effect from July 4, 2025 and December 22, 2025, respectively.
Capital Raising and Share Capital
During FY 2025-26, the Company undertook two significant capital-raising activities. The following table summarises the key details:
| Parameter: | Details |
|---|---|
| Preferential Issue (October 2025): | 69,43,691 equity shares at ₹535 per share |
| Amount Raised (October 2025): | ₹37,148.75 lakhs |
| Warrant Conversions (FY 2025-26): | 7,72,994 warrants converted to equity shares |
| Amount Received on Warrant Conversion: | ₹3,072.65 lakhs |
| Paid-up Share Capital (March 31, 2026): | ₹1,401.89 lakhs (14,01,88,845 equity shares) |
| Paid-up Share Capital (March 31, 2025): | ₹1,324.67 lakhs (13,24,66,748 equity shares) |
Additionally, 5,412 equity shares were allotted upon exercise of stock options under the Borosil Employee Stock Option Scheme 2017. The Board has not recommended any dividend for FY 2025-26 in order to conserve resources for future growth.
Key Financial Ratios (Standalone)
The following table presents significant changes in key standalone financial ratios:
| Ratio: | FY 2025-26 | FY 2024-25 | Change (%) |
|---|---|---|---|
| Debtors' Turnover Ratio: | 13.18 | 10.43 | +26.27% |
| Inventory Turnover Ratio: | 10.48 | 6.95 | +50.79% |
| Interest Coverage Ratio: | 28.56 | 2.81 | +914.77% |
| Current Ratio: | 4.60 | 1.54 | +198.70% |
| Debt-Equity Ratio: | 0.11 | 0.23 | -53.22% |
| Operating Profit Margin (%): | 24.86 | 5.06 | +391.30% |
| Net Profit Margin (%): | 1.35 | 3.02 | -55.18% |
| Return on Net Worth (%): | 1.35 | 2.99 | -54.87% |
Sustainability and Renewable Energy
The Company commissioned a 16.5 MW wind-solar hybrid power plant in March 2026 under a group captive mechanism, taking its renewable energy share to nearly 75% of power requirements. The share of electricity consumption from renewable sources increased from 21.66% in FY 2024-25 to 29.23% in FY 2025-26. Total Scope 1 and Scope 2 GHG emissions stood at 2,06,517.51 tCO2e for FY 2025-26 compared to 1,91,071.46 tCO2e in FY 2024-25. Key sustainability metrics for FY 2025-26 include:
| Parameter: | FY 2025-26 |
|---|---|
| Water Saved: | 35.149 KL |
| Waste Generated: | 1,49,539 tons |
| Waste Recycled: | 1,49,084 tons |
| Total Energy Consumed (Renewable): | 1,52,079.79 GJ |
| Total Energy Consumed (Non-Renewable): | 21,54,911.45 GJ |
| CSR Expenditure: | ₹108.96 lakhs |
CSR spending of ₹108.96 lakhs was directed towards the construction of 342 borewells under the Jal Sanchay Jan Bhagidari initiative of the Ministry of Jal Shakti in Bharuch district and its vicinity areas in Gujarat, against a CSR obligation of ₹95.14 lakhs, resulting in an excess spend of ₹13.82 lakhs.
Innovation and Market Position
Borosil Renewables maintains its position as India's largest manufacturer of low-iron textured solar glass and the world's largest solar glass producer outside China, with a standalone solar glass production capacity of 1,000 tons per day (TPD) at its Bharuch, Gujarat facility. The Company's 2 mm solar glass has emerged as a flagship offering aligned with the industry's transition toward bifacial and glass-glass modules. During the year, the Company also entered the rooftop solar segment by offering Borosil-branded solar panels, inverters, and lithium battery storage solutions. India added a record 44.6 GW of solar capacity in FY 2025-26 and crossed the 150 GW milestone in installed solar capacity, reaching 150.26 GW as of March 31, 2026, providing a strong demand backdrop for the Company's products.
Source: https://lodr-files.dhan.co/lodr-inputs/Company/INE666D01022/14cc2066947743dd.pdf
Historical Stock Returns for Borosil Renewables
| 1 Day | 5 Days | 1 Month | 6 Months | 1 Year | 5 Years |
|---|---|---|---|---|---|
| -1.53% | -1.96% | -5.39% | -13.02% | -35.56% | 0.0% |

How will the expiration or modification of provisional anti-dumping duties on Chinese and Vietnamese solar glass imports impact Borosil Renewables' pricing power and market share in FY 2026-27?
What is the strategic roadmap for the newly launched Borosil-branded rooftop solar panels and storage solutions, and how significant is this segment expected to be in the company's revenue mix over the next three years?
Given the complete write-off of German subsidiaries, what are the company's plans for future international expansion, and will it focus on other European markets or pivot entirely to emerging economies?
 18
18





 Create Custom Screeners
  Access 200+ Pre-built Filters
  Use 50+ Readymade Screener





