

Balkrishna Industries Q1FY27 profit rises 50% to ₹432 cr


Balkrishna Industries Limited posted a 50% increase in Q1FY27 standalone net profit to ₹432.10 crore, fueled by strong OHT volume growth and favorable pricing. The company declared a ₹4 interim dividend and reaffirmed its ₹23,000 crore revenue target for FY30, backed by ₹6,800 crore in planned capex through FY29.



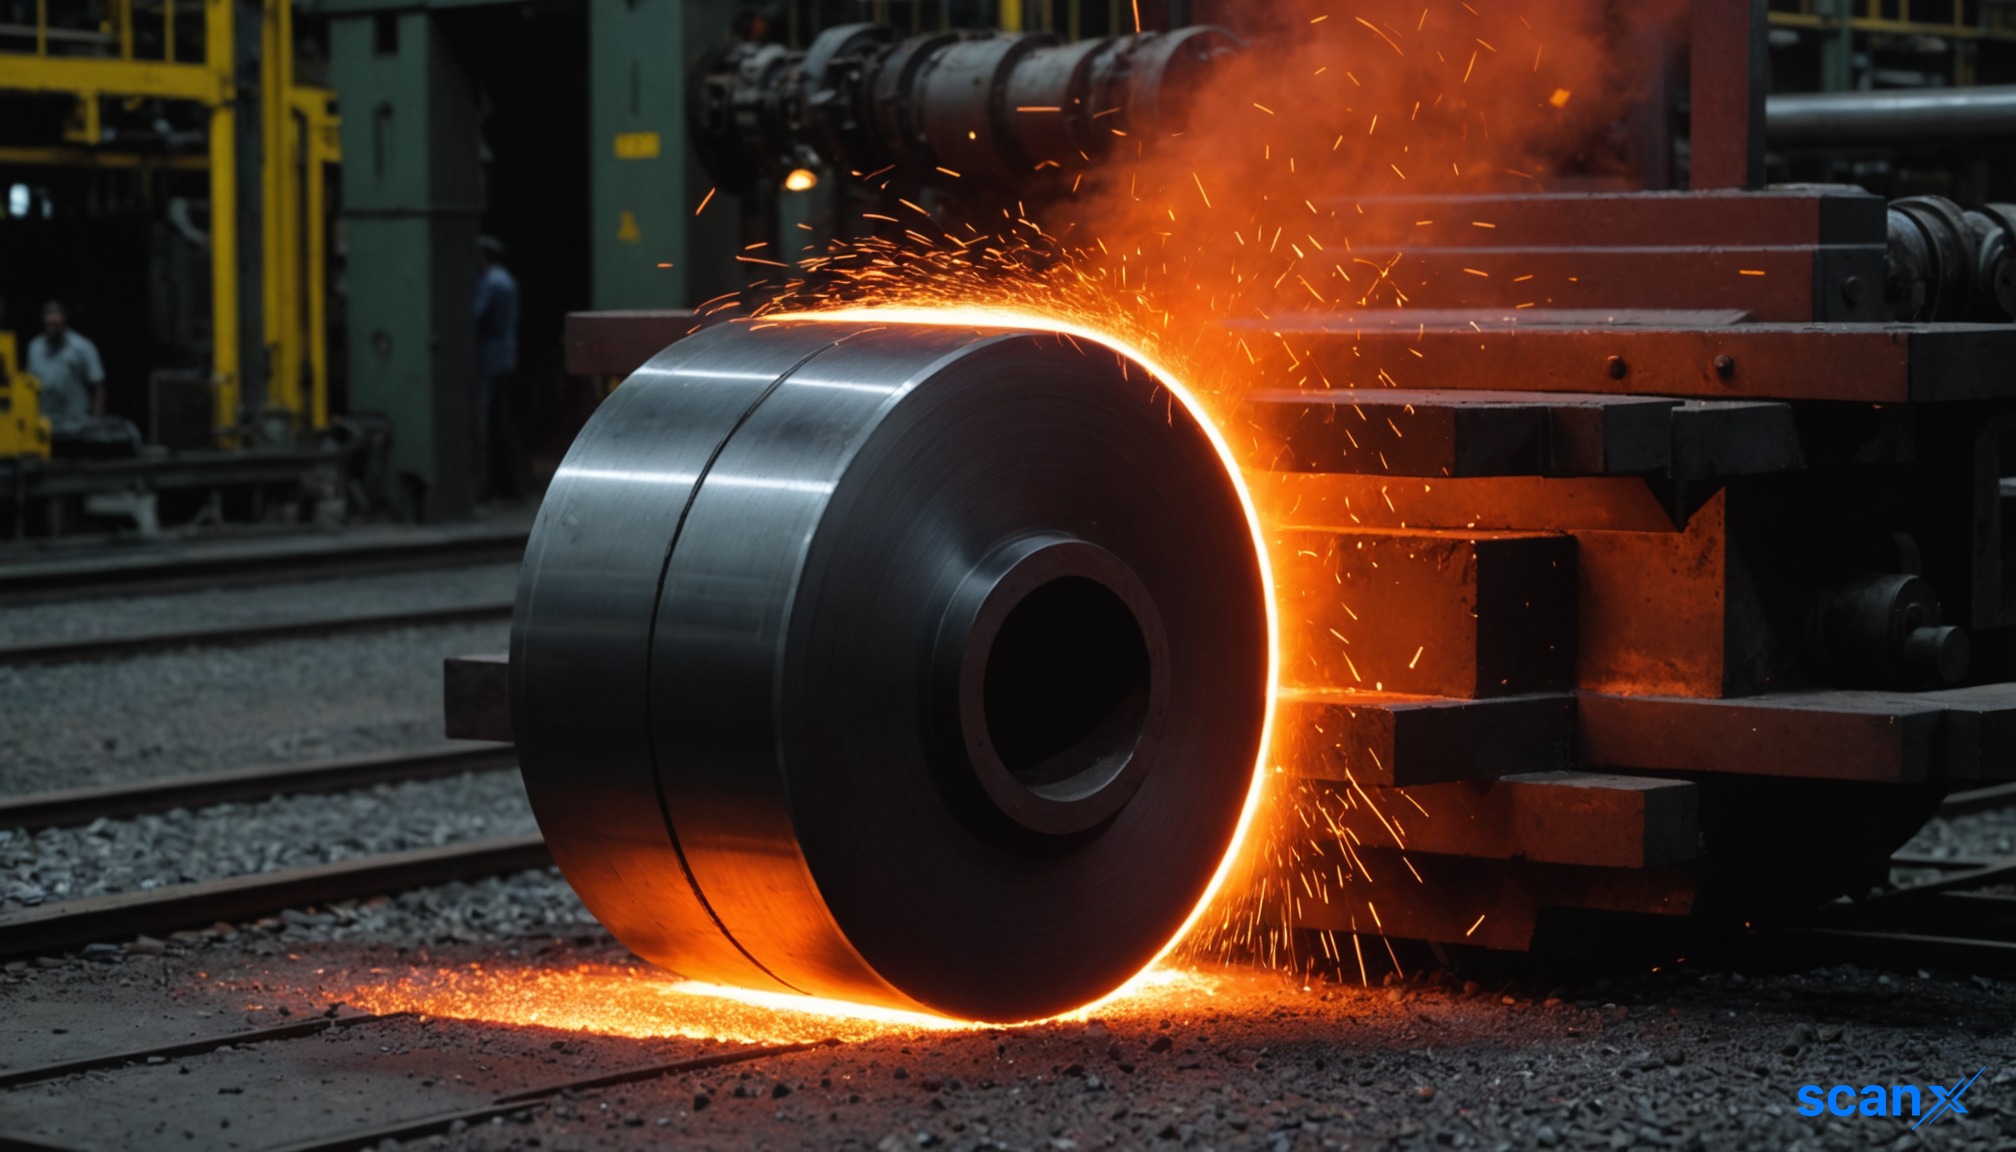
*this image is generated using AI for illustrative purposes only.
Balkrishna Industries Limited reported a 50% year-on-year surge in standalone net profit to ₹432.10 crore for Q1FY27, driven by robust volume growth in its Off-Highway Tire (OHT) segment and favorable average selling price (ASP) dynamics. The company’s revenue from operations climbed 25.2% to ₹3,444.70 crore, reinforcing its aggressive expansion strategy aimed at achieving ₹23,000 crore in revenue by FY30.
The Board of Directors approved the unaudited financial results on July 29, 2026, declaring a first interim dividend of ₹4 per equity share. The filing was submitted to the stock exchanges pursuant to Regulation 47 of the SEBI (Listing Obligations & Disclosure Requirements) Regulations, 2015, with the extract published in Business Standard and Lokmat on July 30, 2026.
Financial Performance Highlights
Standalone total income from operations reached ₹3,444.70 crore in Q1FY27, compared to ₹2,760.46 crore in the same period last year. Net profit before tax stood at ₹581.95 crore, up from ₹391.27 crore in Q1FY26. Earnings per share (basic and diluted) rose to ₹22.35 from ₹14.86 in the previous year’s corresponding quarter.
| Metric | Q1FY27 | Q1FY26 | YoY Change |
|---|---|---|---|
| Revenue from Operations | ₹3,444.70 Cr | ₹2,760.46 Cr | +24.8% |
| Net Profit After Tax | ₹432.10 Cr | ₹287.17 Cr | +50.5% |
| EPS (Basic & Diluted) | ₹22.35 | ₹14.86 | +50.4% |
| Debt Service Coverage Ratio | 4.72 | 2.21 | +113.6% |
Consolidated net profit after tax was ₹450.77 crore, reflecting strong performance across both tire and carbon black businesses. The consolidated debt service coverage ratio improved significantly to 4.72 from 2.21 in Q1FY26, indicating enhanced liquidity and operational efficiency.
Strategic Roadmap and Capacity Expansion
The company reaffirmed its target to reach ₹23,000 crore in revenue by FY30, supported by an overall capital expenditure plan of ₹6,800 crore through FY29. Management clarified that the remaining capex balance stands at ₹3,000 crore, with approximately ₹1,000 crore already spent in FY27. An additional spend of ₹1,500 crore to ₹2,000 crore is expected this fiscal year, bringing total FY27 capex to roughly ₹3,000 crore.
Balkrishna Industries aims to increase its OHT manufacturing capacity to 425,000 MTPA through ongoing investments and debottlenecking initiatives. This expansion is critical to capturing an 8% global market share in the OHT segment, with a long-term vision of reaching 10%. The integrated Carbon Black business, with a capacity of 360,000 MTPA and 64 MW co-gen power at Bhuj, ensures raw material security and energy circularity.
What the Numbers Show
The divergence between volume growth (16%) and revenue growth (25.2%) suggests favorable ASP dynamics or improved product mix in Q1FY27. While EBITDA margin contracted slightly to 20.6% from 23.8% in Q1FY26, absolute EBITDA grew by 7%, indicating that volume gains offset margin pressure. The significant rise in PAT (50%) compared to EBITDA growth highlights the impact of other income and controlled finance costs, reinforcing the efficiency of the integrated business model.
Historical Stock Returns for Balkrishna Industries
| 1 Day | 5 Days | 1 Month | 6 Months | 1 Year | 5 Years |
|---|---|---|---|---|---|
| +0.78% | -3.30% | -8.84% | +0.75% | -9.56% | -17.91% |

How might the projected ₹3,000 crore capex in FY27 impact Balkrishna Industries' near-term free cash flow and debt levels?
What specific strategies is the company employing to mitigate the recent EBITDA margin contraction despite strong volume growth?
How will global macroeconomic factors, such as interest rates or commodity prices, affect the feasibility of reaching an 8% global OHT market share by FY30?
 17
17








 Access Market Heat-map & Insights
  Create, Save & Share your Screener
  Use 200+ Screening Filters





