

ASE Technology Q2FY26 Results: Net income surges 180% YoY


- Net income surged 180% YoY in Q2 2026, outpacing 27% revenue growth
- H1 2026 APM revenues climbed 35%, driving overall 24% top-line growth
- Capex raised by $2 billion to $10.5 billion for AI infrastructure expansion
- Q3 revenue guidance set at 21%-22% QoQ growth; LEAP revenue to double in 2027

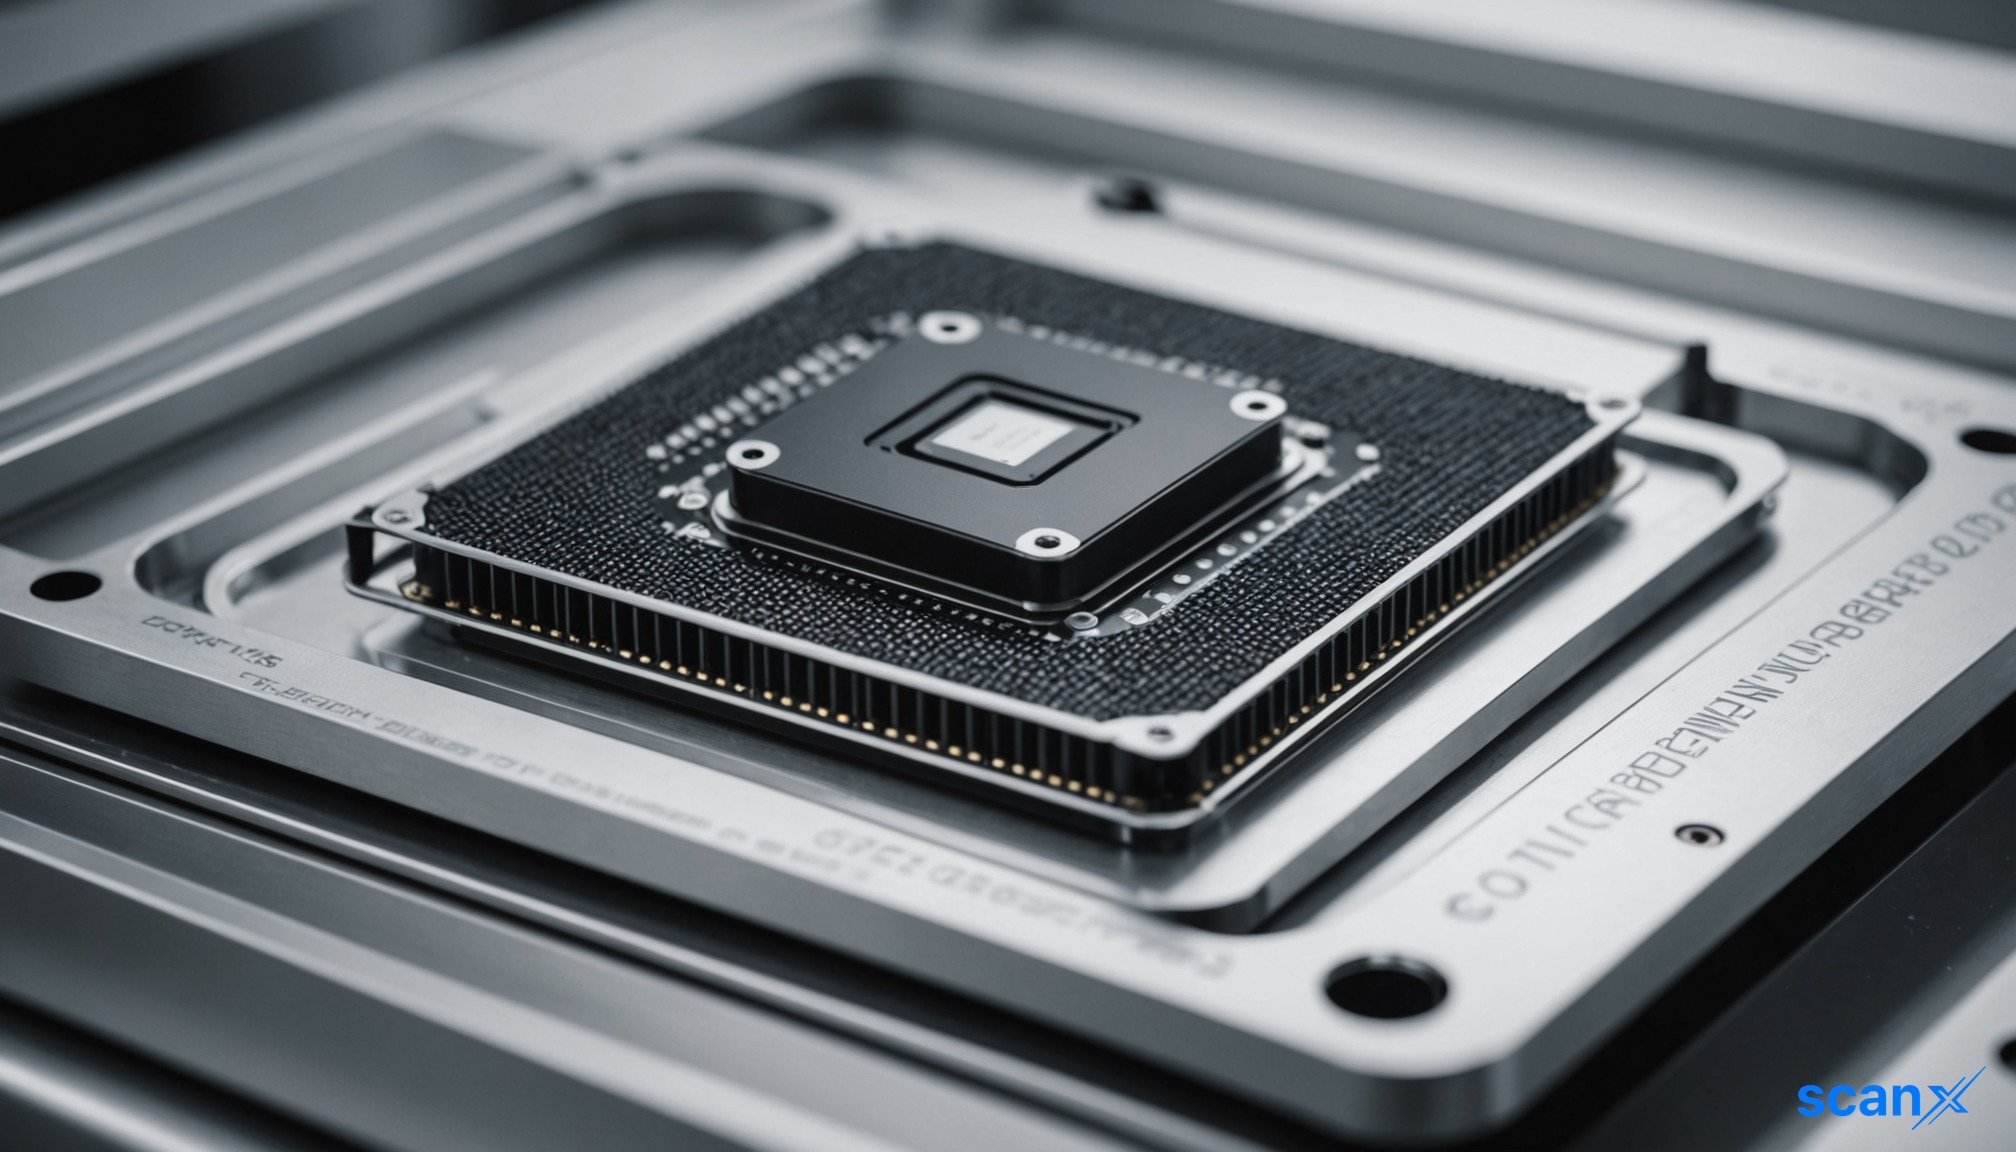

*this image is generated using AI for illustrative purposes only.
ASE Technology Holding Co (NYSE: ASX) reported a 180% year-on-year increase in net income for the second quarter of 2026, supported by strong demand in advanced packaging and testing services.
Consolidated net revenues rose 27% year over year to reach new highs, while gross profit stood at $40.2 billion with a gross margin of 21%. The first half of 2026 saw consolidated revenue grow 24% year on year, with Advanced Packaging and Manufacturing (APM) revenues climbing 35%.
Financial Performance and Outlook
The company expects to maintain growth momentum into the second half of the year. Management projects third-quarter 2026 consolidated revenue to grow 21% to 22% quarter over quarter. Gross margin for the quarter is expected to range between 20.5% and 21.5%, while operating margin should fall between 11.5% and 12.5%.
| Metric | Q3 2026 Guidance | Basis |
|---|---|---|
| Consolidated Revenue Growth | 21% - 22% | Quarter-over-quarter |
| Consolidated Gross Margin | 20.5% - 21.5% | Range |
| Consolidated Operating Margin | 11.5% - 12.5% | Range |
| ATM Revenue Growth | 11% - 13% | Quarter-over-quarter |
| EMS Revenue Growth | ~40% | Quarter-over-quarter |
Assembly and Test (ATM) business revenue is expected to grow 35% for the full year. LEAP services revenue is tracking ahead of prior guidance of $3.5 billion for the year. The company aims to double LEAP revenue in 2027.
Capital Expenditure and Expansion
ASE Technology increased its capital expenditure budget by an additional $2 billion for 2026, bringing the total to approximately $10.5 billion. Of this amount, $4 billion is allocated for new factory buildings and facilities, while $6.5 billion is designated for equipment.
In the first half of 2026, machinery capex was $2.7 billion, with building, facility, and automation spending at $1.4 billion. The company is currently executing 13 greenfield projects and eight brownfield projects to address capacity constraints.
What the Numbers Show
The divergence between the 27% consolidated revenue growth and the 180% net income surge indicates significant operating leverage. This suggests that fixed costs were absorbed more efficiently as volume scaled, or that higher-margin advanced packaging mix contributed disproportionately to bottom-line profits relative to top-line growth.
Strategic Positioning
The company emphasized its role as a pure-play OSAT supplier, highlighting collaboration with partners like Intel on EMIB technology. CEO Tien Wu noted that hardware infrastructure remains a bottleneck for AI applications, driving demand for complex integration capabilities. ASE is expanding U.S. operations, including facilities in California, to support customer requirements for proximity and logistics.

How might the $10.5 billion capital expenditure impact ASE's free cash flow and return on invested capital (ROIC) in the near term?
What are the specific risks associated with executing 13 greenfield projects simultaneously, particularly regarding construction timelines and talent acquisition?
How will the expansion of U.S. facilities in California affect ASE's cost structure compared to its Asian operations?
 18
18





 Access 50+ Readymade Screeners
  Use 200+ Custom Filters
  Get Full Market Insights





