

ASE Technology July revenues jump 30.6% YoY to $2,309m


ASE Technology Holding posted robust July 2026 results with US$2,309 million in net revenues, a 30.6% YoY increase. The Advanced Technology Manufacturing segment led with US$1,487 million, indicating sustained demand for semiconductor assembly and testing services.

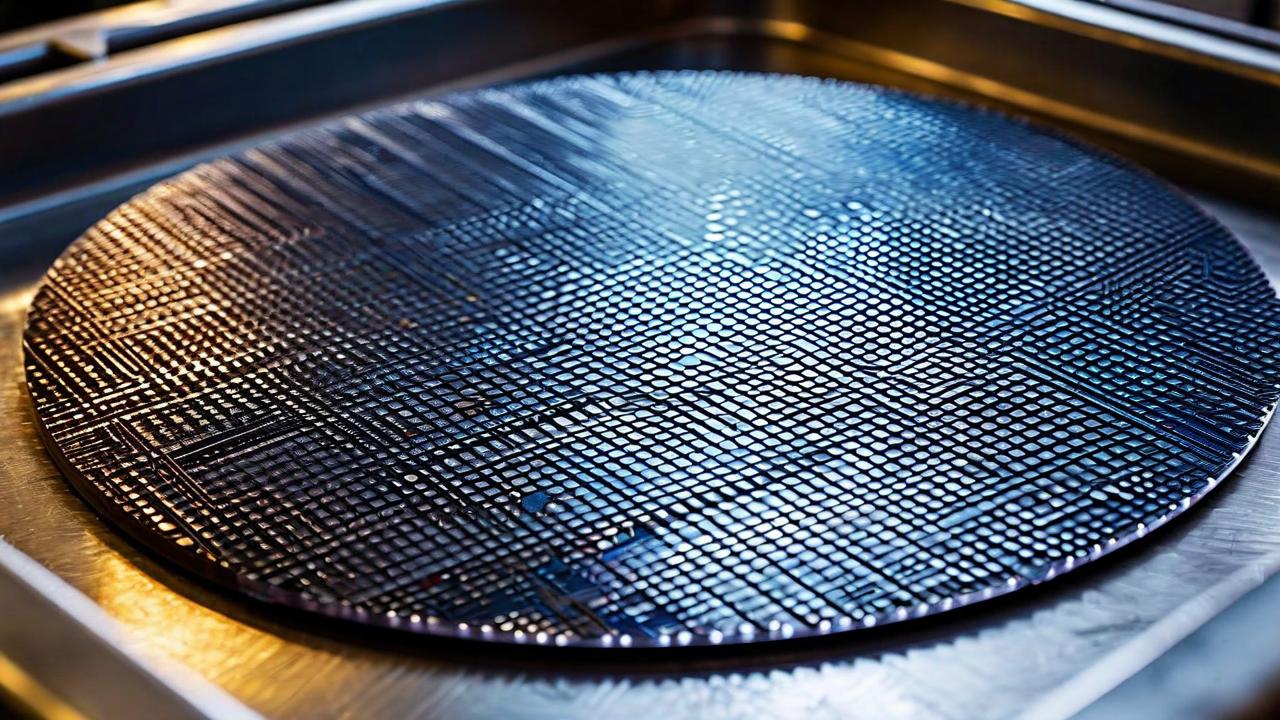

*this image is generated using AI for illustrative purposes only.
Ase Technology Holding Co., Ltd. (NYSE: ASX, IEX: 3711) reported unaudited consolidated net revenues of US$2,309 million (NT$73,784 million) for July 2026, marking a 30.6% year-on-year increase from US$1,769 million in July 2025. The results reflect a 10.4% sequential rise from June 2026’s US$2,092 million, underscoring sustained demand for outsourced semiconductor assembly and testing services amid broader industry recovery.
The Advanced Technology Manufacturing (ATM) segment, which includes assembly, testing, and material business, was the primary growth driver. ATM net revenues reached US$1,487 million (NT$47,524 million), up 36.4% year-on-year from US$1,091 million and up 7.6% sequentially from US$1,383 million in June 2026. The remaining non-ATM business contributed US$822 million to total consolidated revenue, highlighting diversified income streams beyond core advanced packaging.
Financial Performance Overview
| Metric | Jul 2026 | Jun 2026 | Jul 2025 | Sequential Change | YoY Change |
|---|---|---|---|---|---|
| Consolidated Net Revenues (US$ Million) | 2,309 | 2,092 | 1,769 | +10.4% | +30.6% |
| Consolidated Net Revenues (NT$ Million) | 73,784 | 65,783 | 51,542 | +12.2% | +43.2% |
| ATM Net Revenues (US$ Million) | 1,487 | 1,383 | 1,091 | +7.6% | +36.4% |
| ATM Net Revenues (NT$ Million) | 47,524 | 43,485 | 31,783 | +9.3% | +49.5% |
Note: Figures are unaudited. Year-over-year percentage changes in USD reflect currency fluctuation effects alongside operational growth.
What the Numbers Show
The divergence between New Taiwan Dollar (NTD) and US Dollar (USD) growth rates highlights the impact of foreign exchange movements on reported figures. While NTD-based revenues surged 43.2% year-on-year, USD-based revenues grew by 30.6%. Similarly, sequential growth was 12.2% in NTD terms versus 10.4% in USD terms. This suggests that while operational volume and pricing power are driving substantial real growth, currency translation effects moderated the headline USD figures. Investors should monitor subsequent quarters to distinguish between organic demand expansion and forex tailwinds as the semiconductor cycle progresses.

How might the widening gap between NTD and USD revenue growth rates impact ASX's future margin projections if the US dollar continues to weaken against the New Taiwan Dollar?
What specific end-market segments (e.g., AI, automotive, consumer electronics) are primarily driving the 36.4% year-on-year surge in the Advanced Technology Manufacturing (ATM) segment?
Given the strong sequential growth in July, does ASX anticipate sustaining this momentum into Q3 2026, or are there signs of seasonal normalization ahead?
 17
17







 Access Market Heat-map & Insights
  Create, Save & Share your Screener
  Use 200+ Screening Filters





