

Arman Holdings Q1FY27 revenue surges 4,284% YoY to ₹1,422 lakh


Arman Holdings saw its Q1FY27 revenue surge 4,284% YoY to ₹1,422 lakh, driven by entry into the chemicals segment. The company turned profitable with a PAT of ₹70 lakh, reversing a loss in the prior year period. The chemicals segment now accounts for nearly 70% of total revenue.


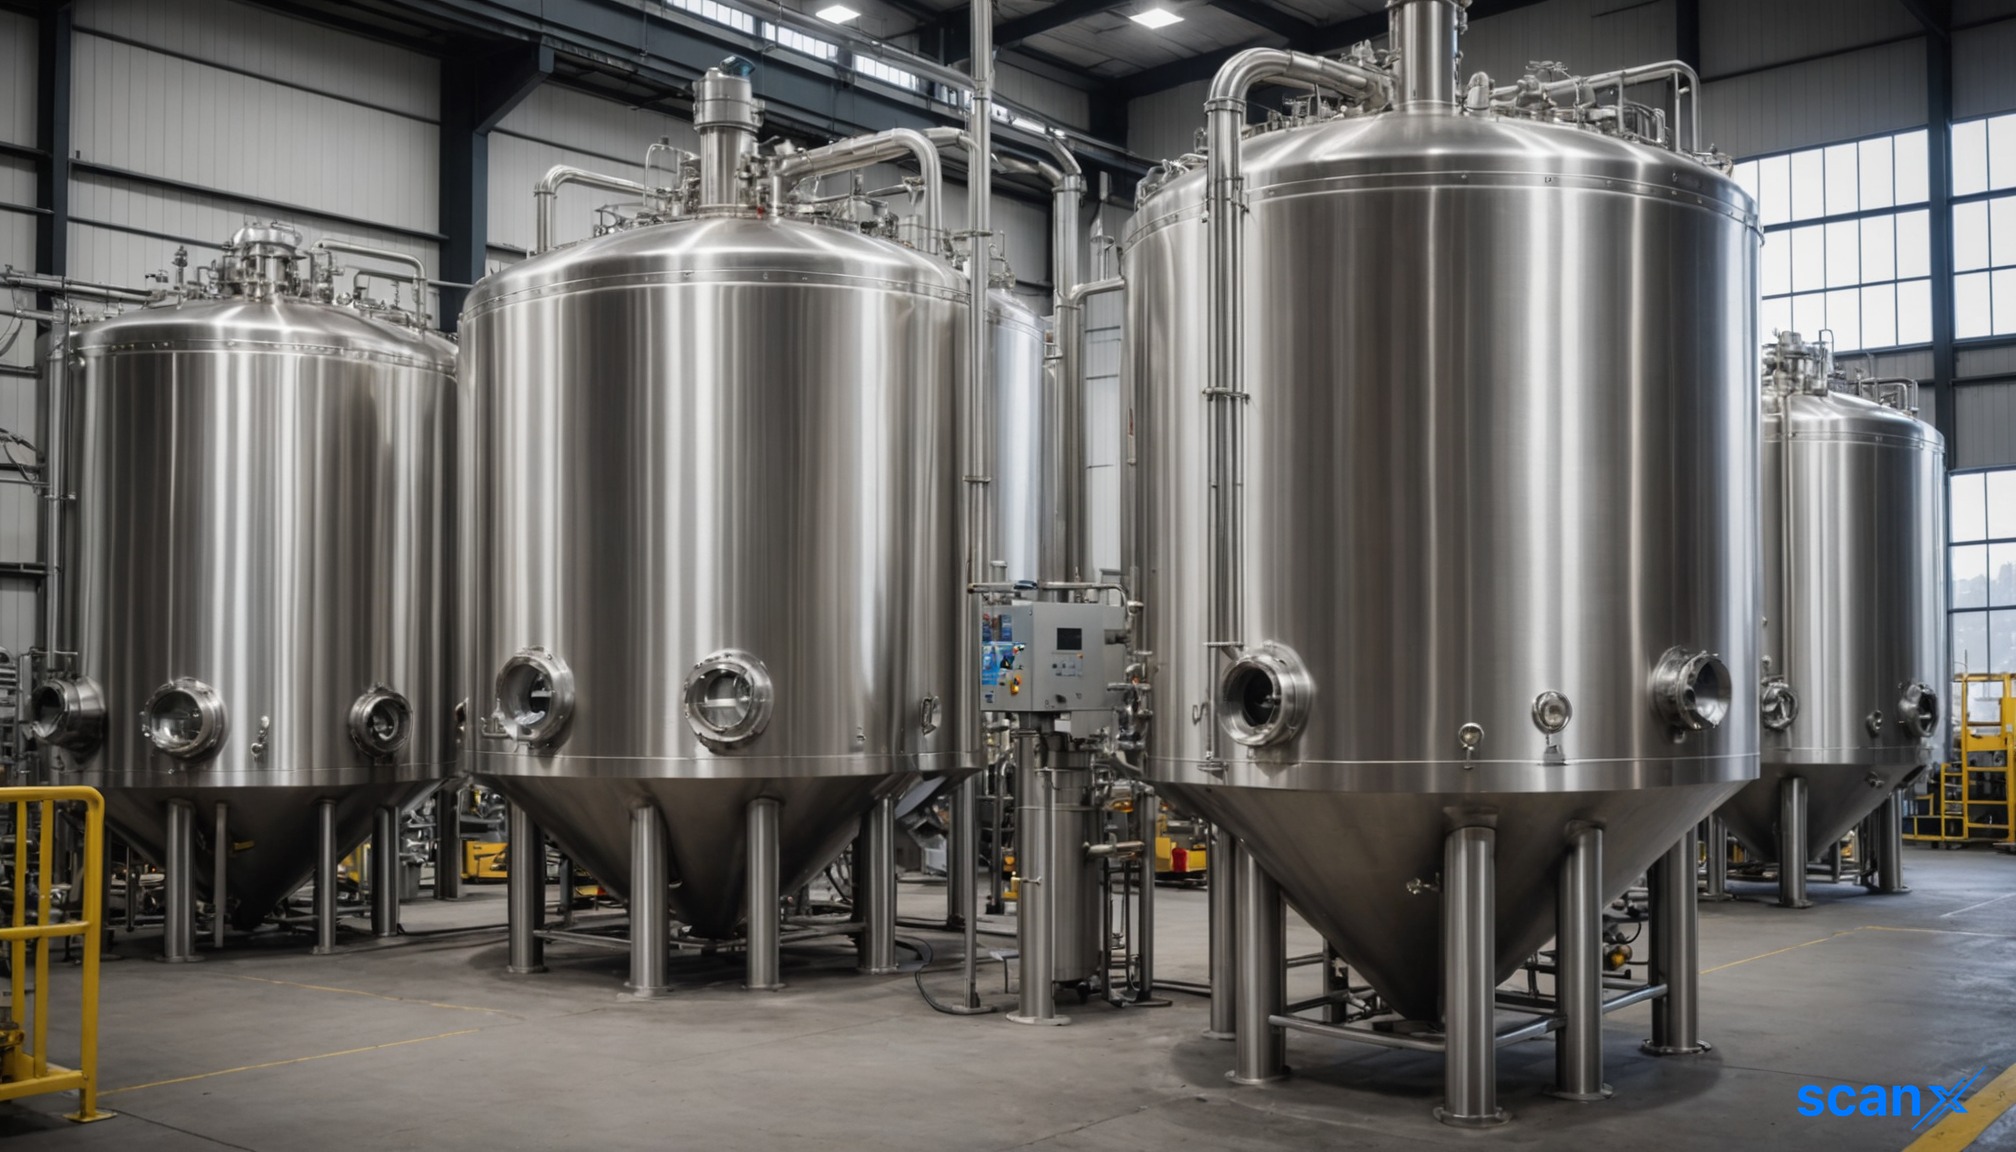
*this image is generated using AI for illustrative purposes only.
Arman Holdings reported a substantial increase in standalone revenue and profitability for the first quarter of FY27 (ended June 30, 2026). The company’s total revenue from operations rose to ₹1,422.04 lakh, a significant jump from ₹32.58 lakh in the same quarter last year. Net profit after tax (PAT) improved to ₹70.13 lakh, turning around from a loss of ₹0.73 lakh in Q1FY26.
The Board of Directors approved the unaudited financial results during a meeting held on August 13, 2026. The statutory auditor, HRJ & Associates, issued a limited review report with an unmodified opinion on the standalone financials.
Financial Performance
Revenue from operations expanded significantly quarter-on-quarter as well, rising from ₹179.12 lakh in Q4FY26 to ₹1,422.04 lakh in Q1FY27. Total expenses increased to ₹1,328.34 lakh from ₹94.78 lakh in the preceding quarter, reflecting higher operational activity.
| Metric: | Q1FY27 | Q4FY26 | Q1FY26 |
|---|---|---|---|
| Revenue from Operations: | ₹1,422.04 lakh | ₹179.12 lakh | ₹32.58 lakh |
| Total Expenses: | ₹1,328.34 lakh | ₹94.78 lakh | ₹33.31 lakh |
| Profit Before Tax: | ₹93.70 lakh | ₹84.39 lakh | ₹(0.73) lakh |
| Net Profit After Tax: | ₹70.13 lakh | ₹63.53 lakh | ₹(0.73) lakh |
Earnings per share (basic) were reported at ₹1.80, compared to ₹1.62 in the previous quarter and a loss of ₹0.01 in Q1FY26. Current tax expense amounted to ₹23.57 lakh.
Segment-wise Breakdown
The revenue surge was largely attributed to the chemicals segment, which contributed ₹985.40 lakh in the current quarter, whereas it had no revenue contribution in the preceding quarter or the corresponding period last year. The precious metal and stones segment generated ₹436.64 lakh, up from ₹173.29 lakh in Q4FY26 and ₹32.58 lakh in Q1FY26. The textiles products segment reported no revenue in Q1FY27.
| Segment: | Q1FY27 Revenue | Q4FY26 Revenue | Q1FY26 Revenue |
|---|---|---|---|
| Chemicals: | ₹985.40 lakh | ₹0.00 lakh | ₹0.00 lakh |
| Precious Metal & Stones: | ₹436.64 lakh | ₹173.29 lakh | ₹32.58 lakh |
| Textiles Products: | ₹0.00 lakh | ₹5.83 lakh | ₹0.00 lakh |
| Total: | ₹1,422.04 lakh | ₹179.12 lakh | ₹32.58 lakh |
Segment results before tax and interest showed that the chemicals segment contributed ₹76.10 lakh, while precious metal and stones added ₹27.11 lakh. Total segment assets rose to ₹2,149.50 lakh, driven by an increase in assets under the chemicals segment to ₹1,349.42 lakh.
What the Numbers Show
The financial data reveals a distinct shift in business mix, with the chemicals segment emerging as the primary revenue driver in Q1FY27, contributing approximately 69% of total revenue. This contrasts sharply with the prior year, where precious metal and stones constituted the entirety of reported operations. The simultaneous rise in purchases of stock-in-trade (₹1,628.50 lakh) and inventory changes suggests active trading or inventory buildup in the new chemical business line.
Historical Stock Returns for Arman Holdings
| 1 Day | 5 Days | 1 Month | 6 Months | 1 Year | 5 Years |
|---|---|---|---|---|---|
| +1.03% | -1.37% | +14.46% | +24.59% | +58.77% | 0.0% |

What specific catalysts or contracts drove the sudden emergence of the chemicals segment, and is this revenue growth sustainable beyond Q1FY27?
How does the company plan to manage the significant increase in stock-in-trade purchases (₹1,628.50 lakh) relative to revenue, and what are the associated working capital risks?
With the textiles segment reporting zero revenue, has Arman Holdings strategically exited this business line, or is this a temporary pause in operations?
 15
15







 Create Custom Screeners
  Access 200+ Pre-built Filters
  Use 50+ Readymade Screener





