APL Apollo: Company Misses Q4 Volume Targets


APL Apollo Tubes delivered Q4FY26 sales volume of 924,881 tons, marking 8.7% year-on-year growth but falling well short of the company's 20% growth guidance. While achieving record quarterly volumes, the structural steel tube manufacturer showed mixed product-wise performance with Apollo Structural General leading at 17.10% growth and Apollo Galv segment growing 18.90%, while some categories declined.

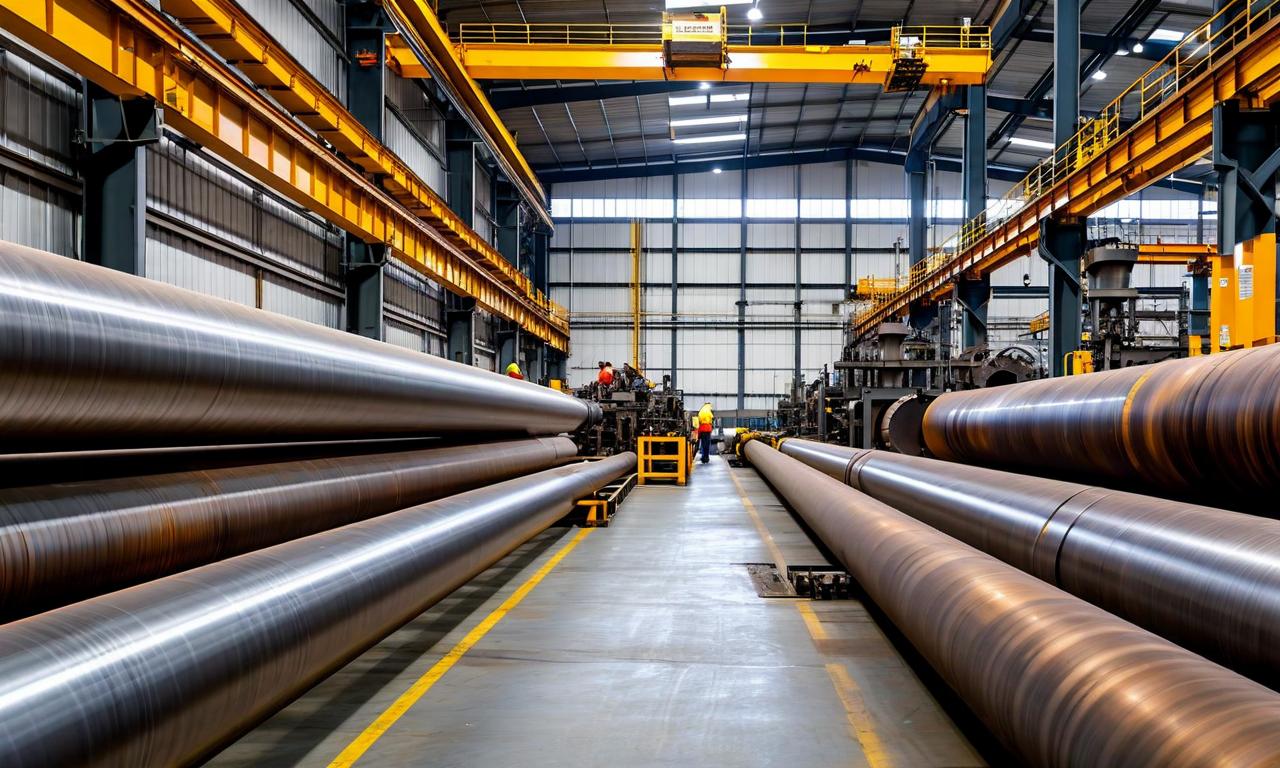
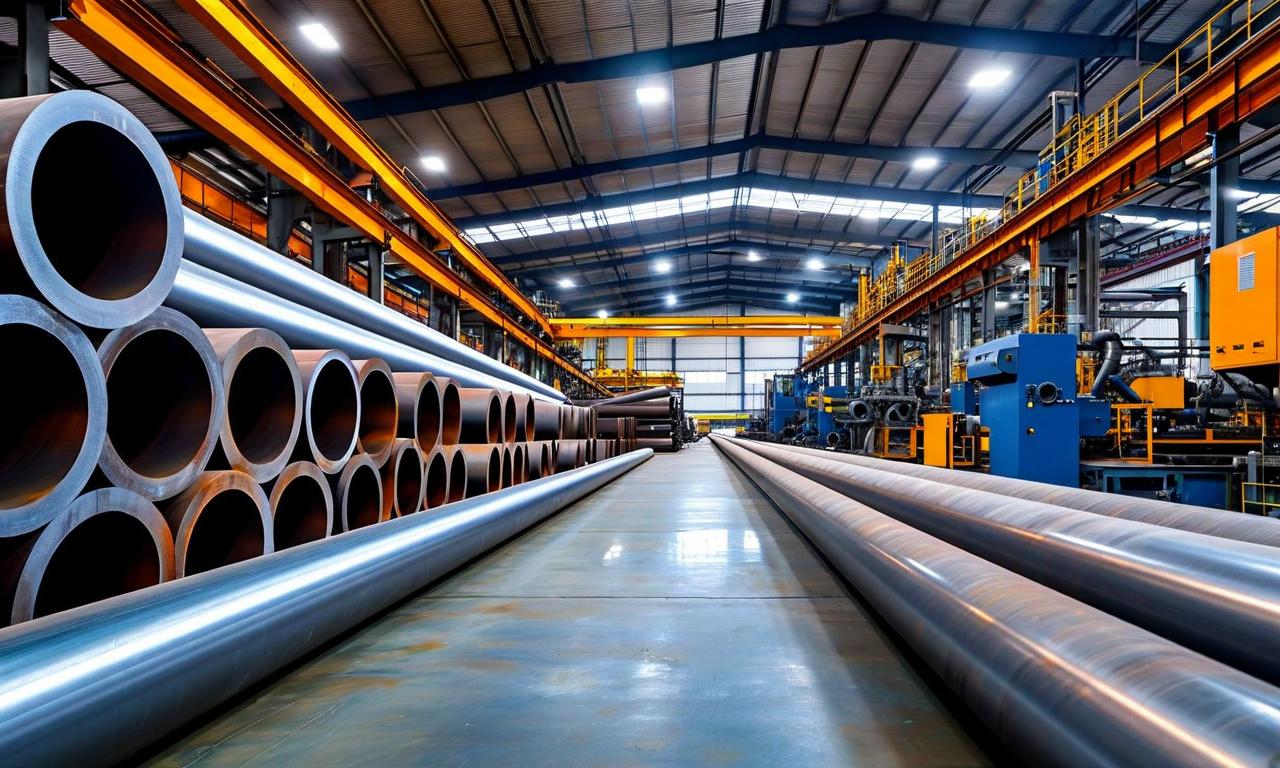
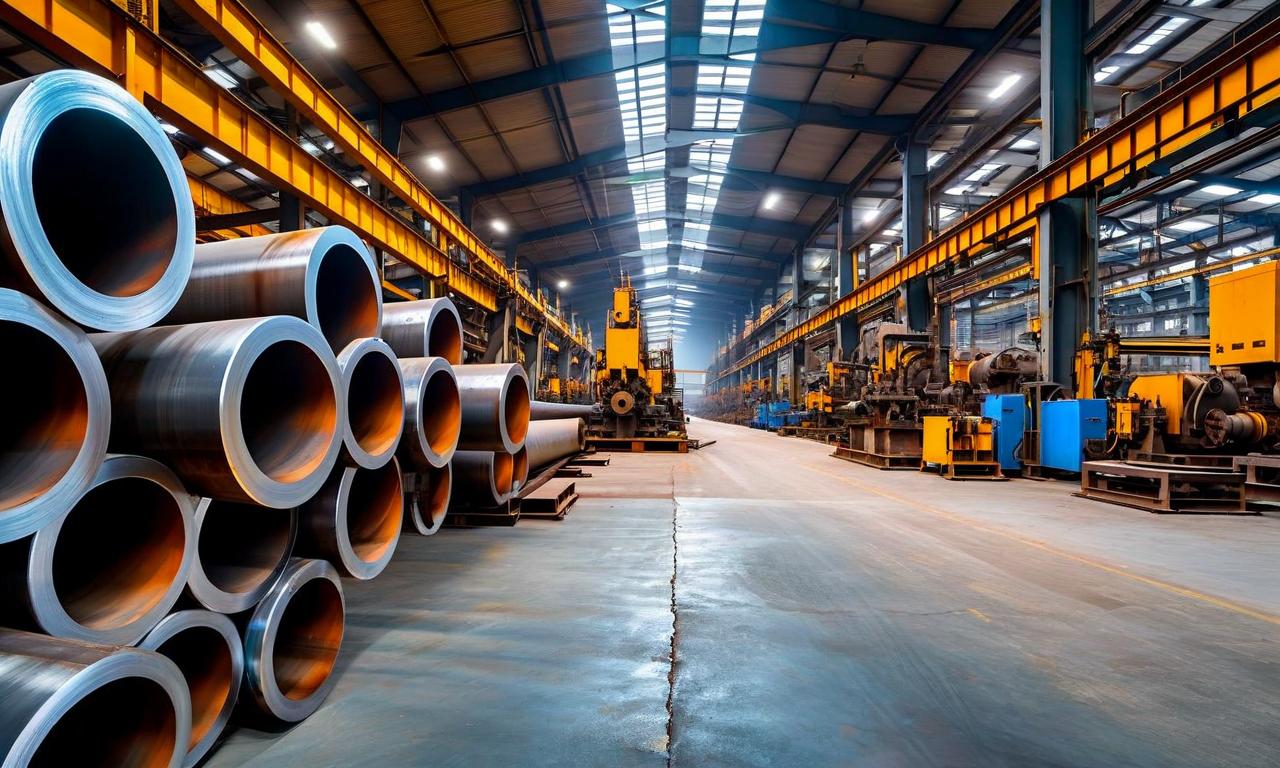
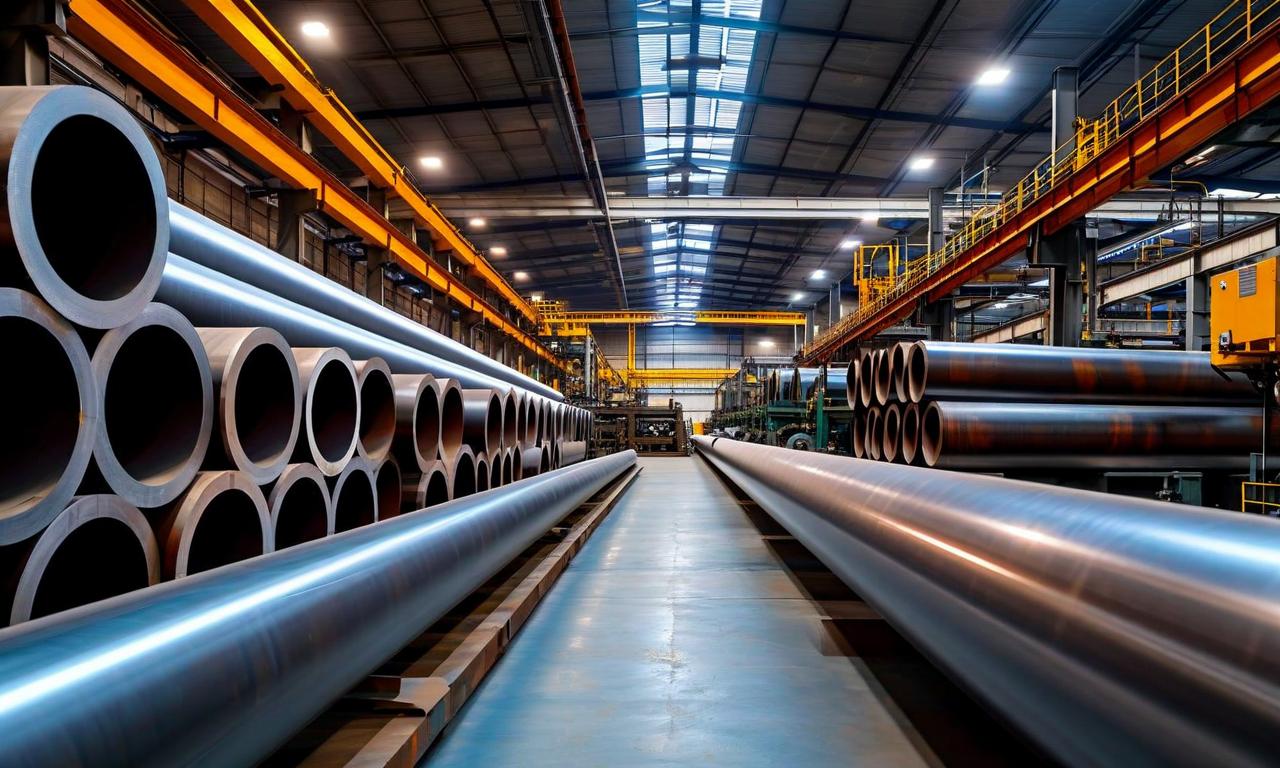
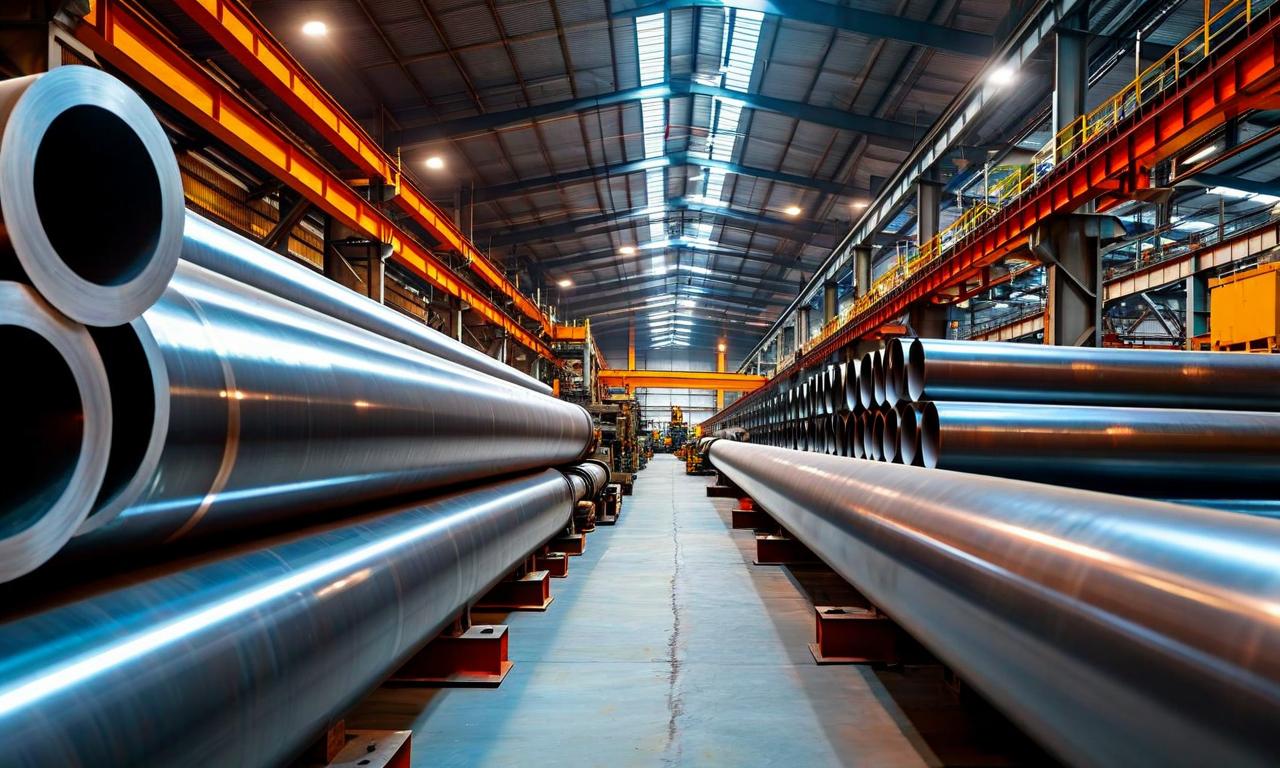
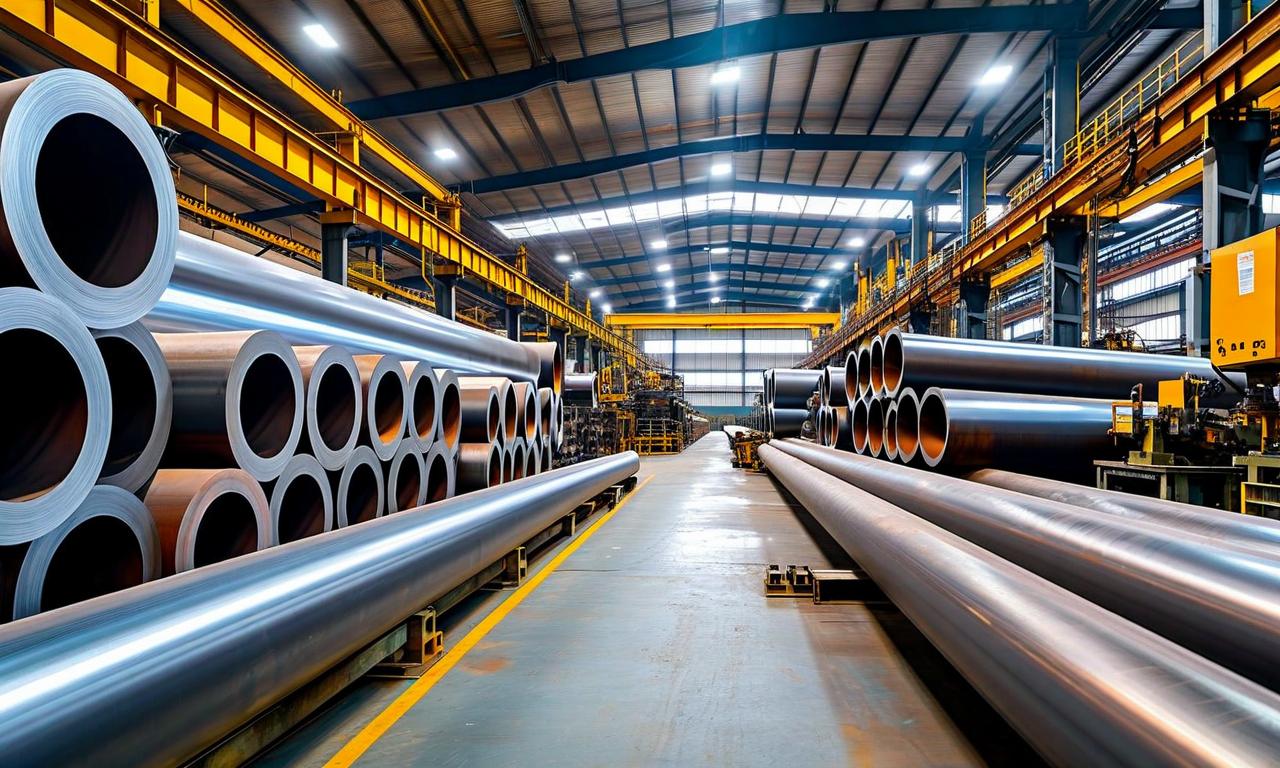
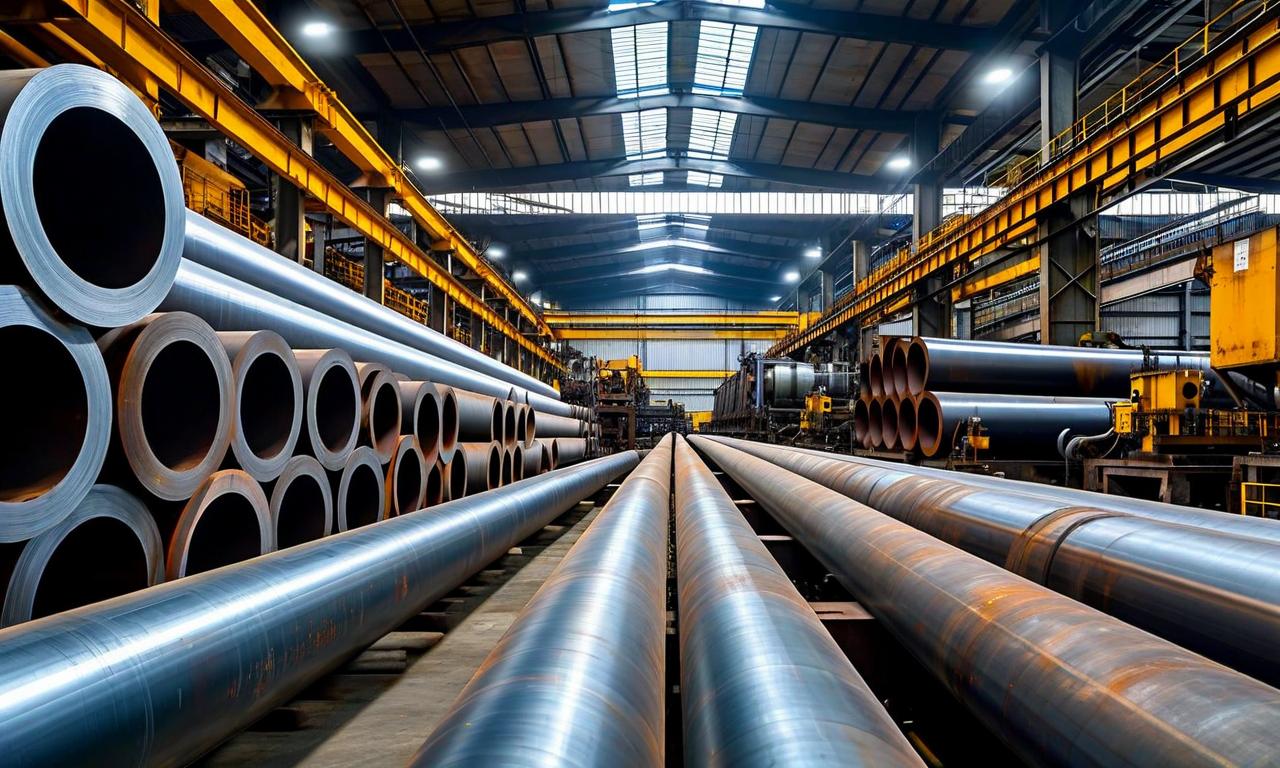
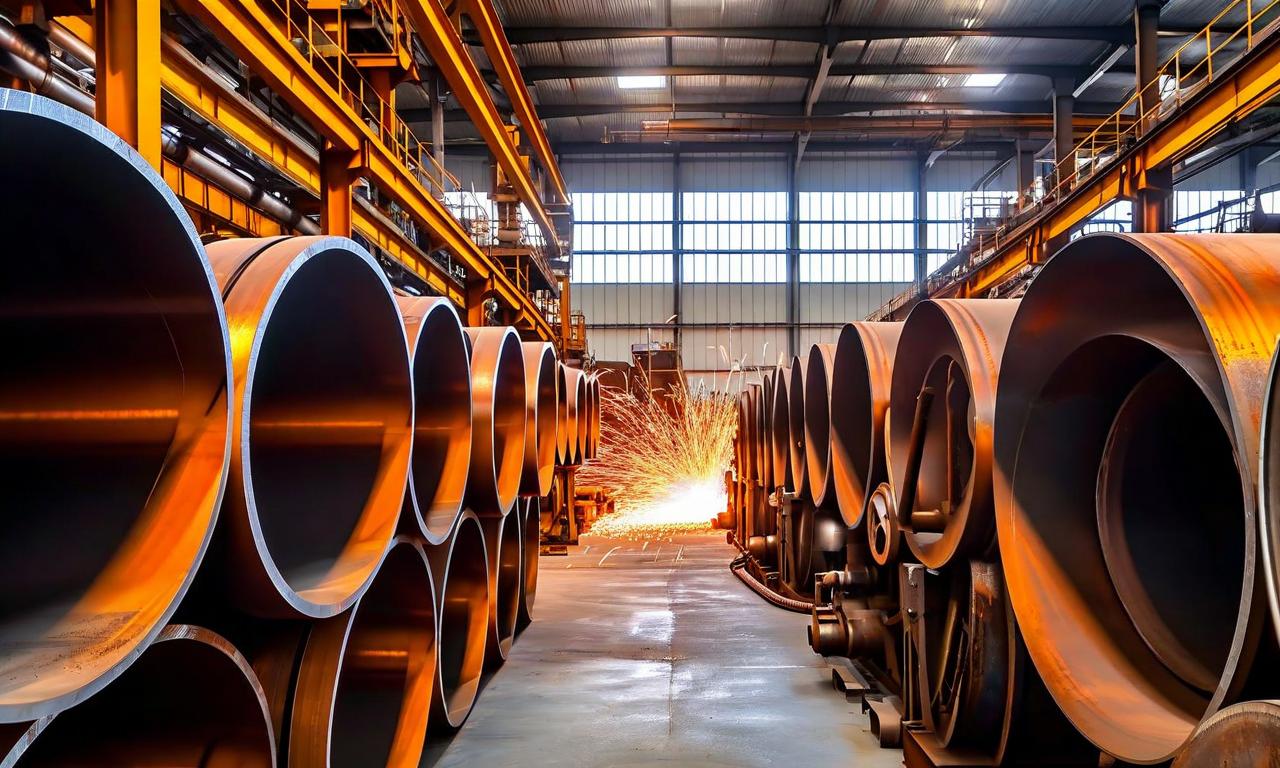
*this image is generated using AI for illustrative purposes only.
APL Apollo Tubes Limited reported Q4FY26 sales volume of 924,881 tons, representing growth of 8.7% year-on-year, which fell significantly short of the company's guidance of 20% growth for the quarter. The world's largest branded structural steel tube company achieved an all-time high quarterly volume despite missing its growth targets.
Performance Against Guidance
The company's actual performance showed a notable gap compared to management expectations, with volume growth coming in at less than half the projected rate.
| Metric: | Q4FY26 Actual | Growth Rate | Guidance |
|---|---|---|---|
| Sales Volume: | 924,881 tons | +8.7% YoY | 20% growth |
| Previous Year: | 850,447 tons | - | - |
| Annual Volume (FY26): | 3,491,243 tons | +11% YoY | - |
Product-Wise Performance Analysis
Despite missing overall guidance, the company demonstrated mixed performance across its diversified product portfolio, with some categories showing strong momentum while others faced challenges.
| Product Category: | Q4FY26 (Tons) | Q4FY25 (Tons) | Growth (%) |
|---|---|---|---|
| Apollo Structural - Heavy: | 84,395 | 81,583 | +3.40% |
| Apollo Structural - Light: | 141,157 | 142,797 | -1.10% |
| Apollo Structural - General: | 413,574 | 353,293 | +17.10% |
| Apollo Z - Rust-proof: | 194,905 | 184,636 | +5.60% |
| Apollo Z - Coated: | 51,664 | 55,174 | -6.40% |
| Apollo Galv - Agri/Industrial: | 39,186 | 32,964 | +18.90% |
Market Position and Operational Capacity
The Apollo Structural General category emerged as the strongest performer, contributing 413,574 tons in Q4FY26 with a robust 17.10% year-on-year increase. The Apollo Galv segment for agricultural and industrial applications also showed strong momentum with 18.90% growth, while some segments like Apollo Structural Light and Apollo Z Coated experienced declines.
The company maintains its market leadership position with manufacturing capacity of 4.5 million tons across 11 strategically located facilities. With over 5,000 product varieties and a distribution network spanning 800+ distributors across 300+ towns and cities, APL Apollo continues to serve structural steel applications in urban infrastructure, real estate, and commercial construction sectors, though the guidance shortfall indicates potential market headwinds or execution challenges.
Historical Stock Returns for APL Apollo Tubes
| 1 Day | 5 Days | 1 Month | 6 Months | 1 Year | 5 Years |
|---|---|---|---|---|---|
| +1.35% | +0.19% | -0.57% | -5.76% | +7.73% | +151.90% |
What factors contributed to APL Apollo missing its 20% growth guidance, and how will management adjust its strategy for FY27?
Will the company revise its manufacturing capacity expansion plans given the slower-than-expected volume growth?
How might the mixed performance across product categories influence APL Apollo's future product mix and pricing strategy?
 17
17