

Aarti Industries files FY26 BRSR report with TUV assurance


- Aarti Industries filed its BRSR report for FY26 with reasonable assurance from TÜV India
- Total energy consumption rose to 92,32,436 GJ while renewable share declined
- Scope 1 and 2 GHG emissions totaled 902,826 metric tonnes of CO2 equivalent
- Loans and advances to related parties jumped to 59.57% of total from 6.64%
- Worker Lost Time Injury Frequency Rate improved to 0.10 from 0.21

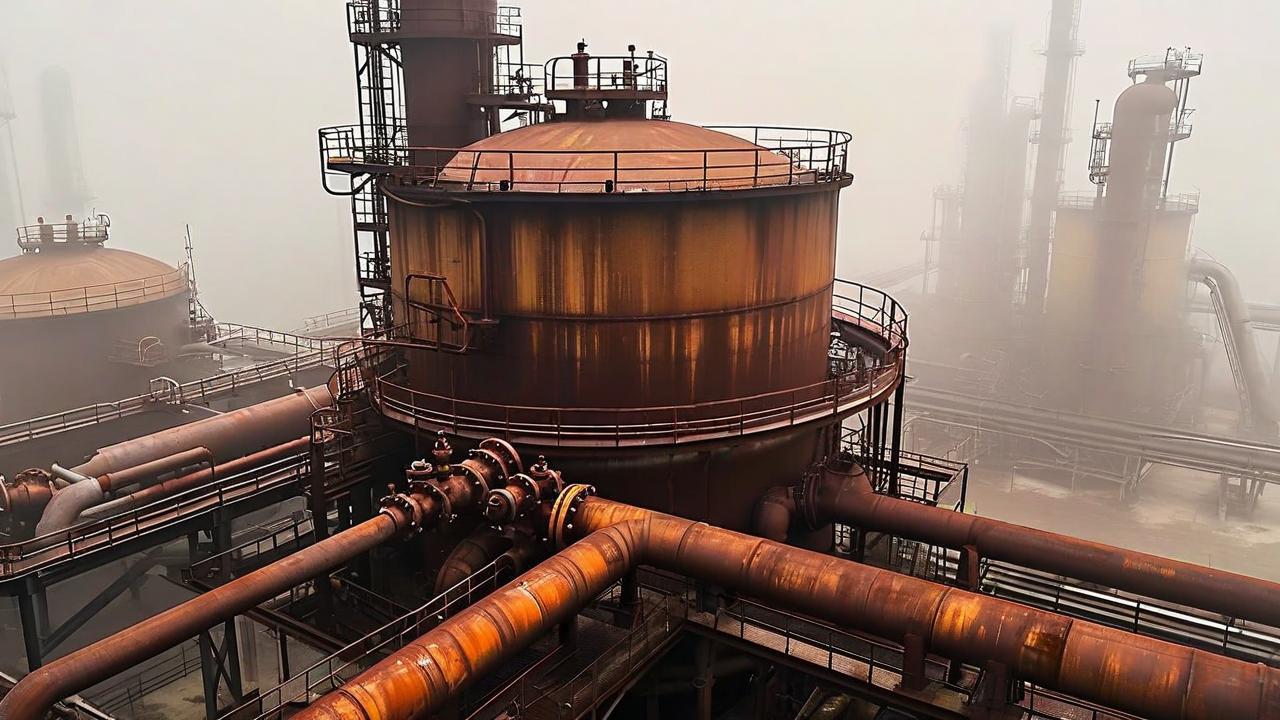

*this image is generated using AI for illustrative purposes only.
Aarti Industries Limited submitted its Business Responsibility and Sustainability Report (BRSR) for the financial year ending March 31, 2026. The filing discloses environmental, social, and governance metrics across its operations.
The report received reasonable assurance from TÜV India Private Limited for its core indicators. Aarti Industries reported a turnover of ₹9,018 crore and a net worth of ₹5,955 crore for the period.
Operational Metrics
The company operates 16 plants and five offices globally. It serves customers in 30 states in India and 60 countries internationally. Exports contributed 57% of total turnover during the fiscal year.
Environmental Performance
Aarti Industries consumed 92,32,436 GJ of total energy in FY26, up from 80,75,770 GJ in the prior year. Renewable energy consumption fell to 1,93,406 GJ from 2,01,466 GJ. Total greenhouse gas emissions from Scope 1 and Scope 2 sources reached 902,826 metric tonnes of CO2 equivalent.
| Metric | FY26 | FY25 |
|---|---|---|
| Total Energy Consumed (GJ) | 92,32,436 | 80,75,770 |
| Scope 1 Emissions (MT CO2e) | 706,923 | 620,823 |
| Scope 2 Emissions (MT CO2e) | 195,903 | 171,010 |
| Water Consumption (KL) | 2,896,715 | 2,648,487 |
Water consumption rose to 2,896,715 kilolitres from 2,648,487 kilolitres. The company generated 536,355 metric tonnes of waste, recycling 490,740 metric tonnes of plastic and other materials.
Social Indicators
The workforce comprised 2,302 employees and 10,781 workers as of March 31, 2026. Female representation among employees stood at 6.65%. The Lost Time Injury Frequency Rate for workers was 0.10 per million person-hours worked, down from 0.21 in the previous year.
What the Numbers Show
Related-party transactions show a significant shift in capital allocation. While sales to related parties increased to 24.50% of total sales from 15.81%, loans and advances to related parties surged to 59.57% of total loans and advances, up sharply from 6.64% in FY25. This concentration suggests a heavy reliance on internal group financing rather than external debt or trade credit for liquidity management.
Historical Stock Returns for Aarti Industries
| 1 Day | 5 Days | 1 Month | 6 Months | 1 Year | 5 Years |
|---|---|---|---|---|---|
| -3.74% | -1.06% | -8.65% | +9.12% | +22.62% | -52.47% |

How will the sharp increase in related-party loans to 59.57% of total advances impact Aarti Industries' liquidity flexibility and credit rating outlook?
What specific capital expenditure plans are driving the 14% year-on-year increase in total energy consumption and associated Scope 1 emissions?
Given the decline in renewable energy usage, what is Aarti Industries' roadmap for meeting long-term decarbonization targets amid rising global ESG scrutiny?
 15
15











 Create Custom Screeners
  Access 200+ Pre-built Filters
  Use 50+ Readymade Screener





