

Satellite data shows thermal anomalies near Saudi Arabia's key oil pipeline


- NASA detected eight thermal anomalies near Saudi Arabia's East-West pipeline
- The pipeline has a capacity of 7 million barrels per day
- Houthis captured Mocha, potentially expanding control over Red Sea routes
- Unverified images show smoke columns in the region

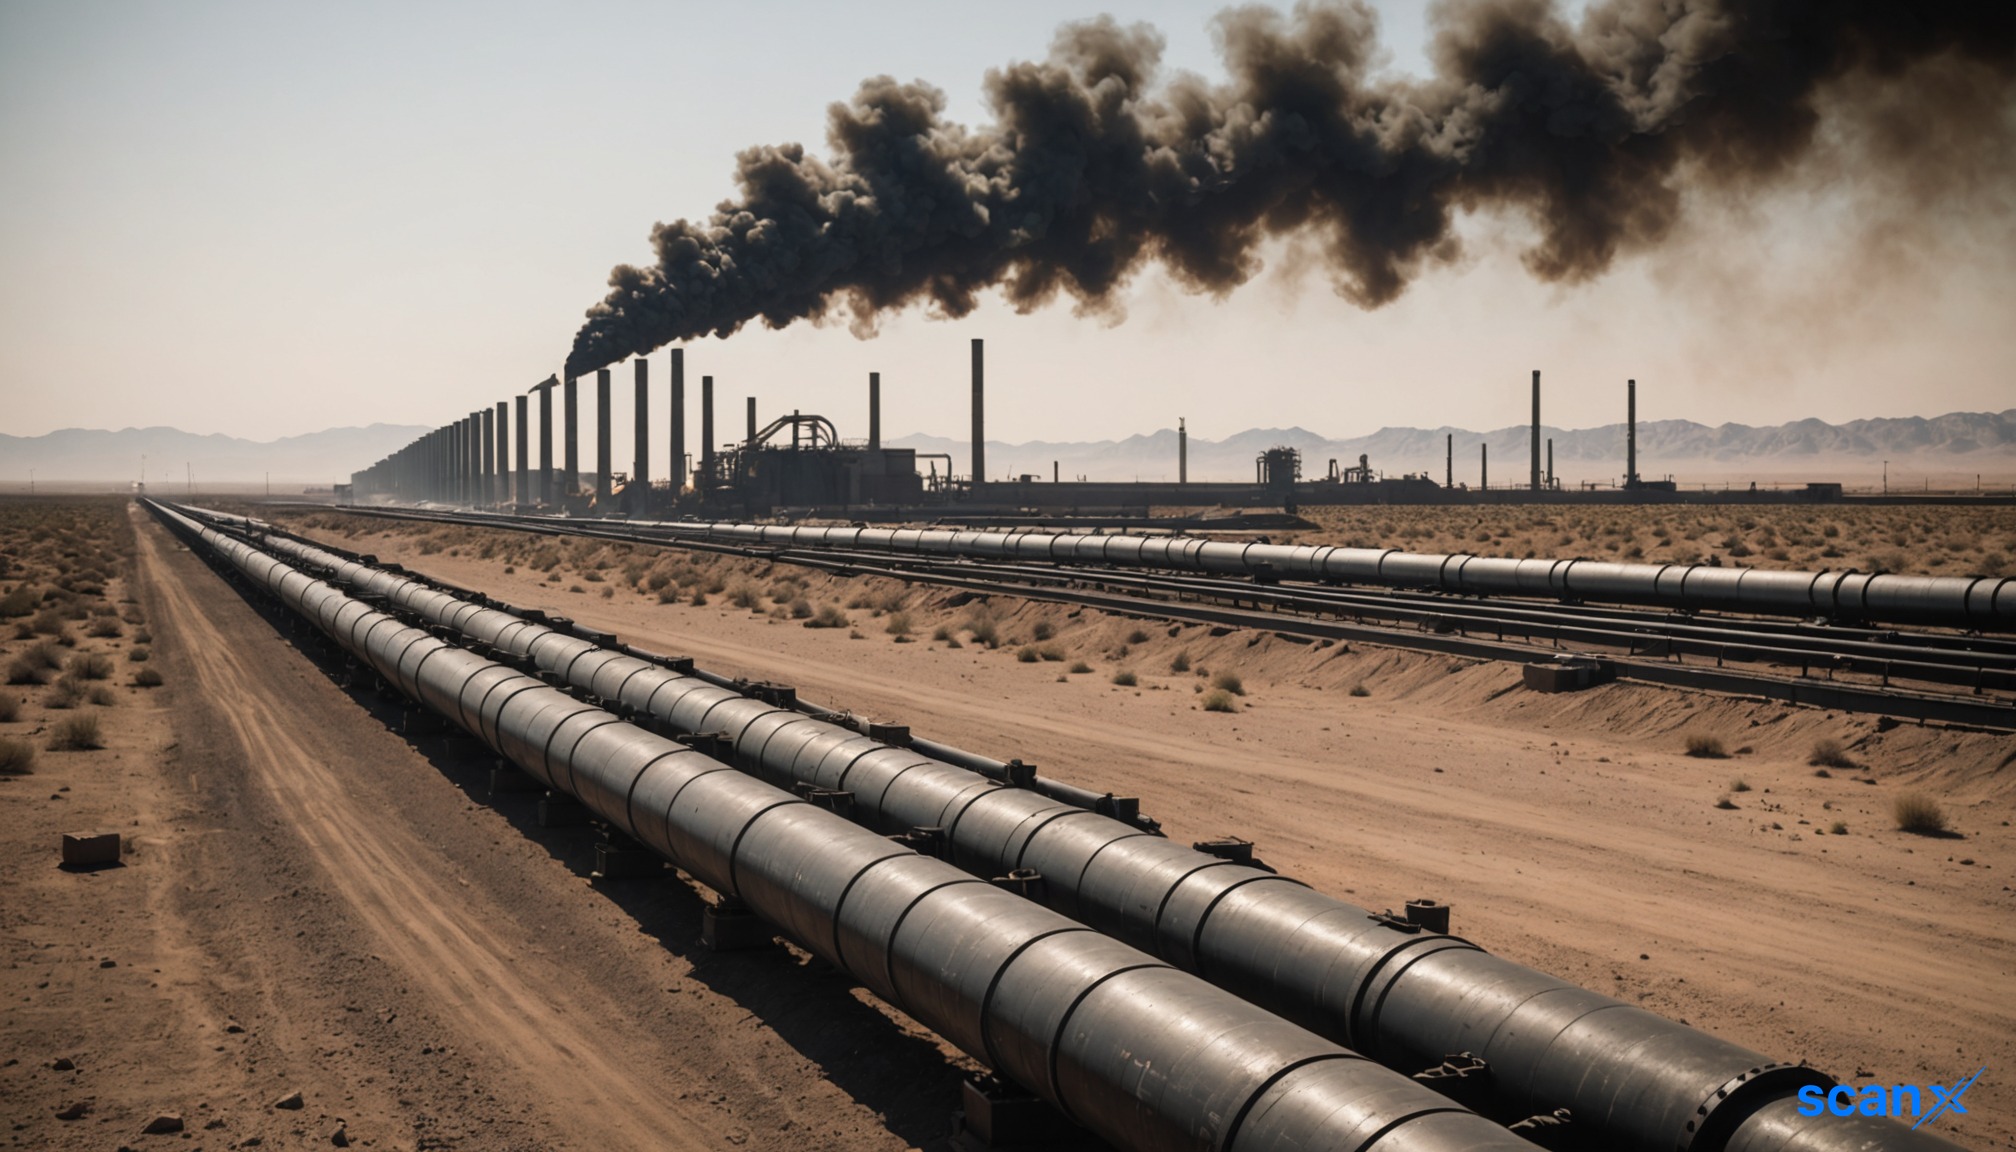

*this image is generated using AI for illustrative purposes only.
Unconfirmed reports suggest Yemen's Houthis may have attacked Saudi Arabia's critical East-West oil pipeline. NASA satellite data detected eight thermal anomalies in the region on Thursday, though the cause remains unverified.
The pipeline, which runs roughly 746 miles from Abqaiq to Yanbu, has a capacity of 7 million barrels per day. It serves as a vital alternative to the Strait of Hormuz for exporting crude oil via the Red Sea.
Satellite and Ground Reports
NASA's Fire Information for Resource Management System (FIRMS) identified several high-confidence thermal anomalies. The data does not confirm whether the pipeline infrastructure itself was damaged or if the heat signatures stem from other sources.
Social media platform X shared unverified ground images purporting to show a massive black smoke column rising from the area. These images align with Sentinel-3 satellite imagery showing similar plumes.
Strategic Context
The East-West pipeline was constructed in the 1980s to bypass the Strait of Hormuz during Iran-Iraq tensions. Its potential disruption carries significant weight for global oil supply chains, particularly as the Houthis recently captured the port city of Mocha.
Control of Mocha could expand Houthi influence over the Bab el-Mandeb Strait, a key chokepoint connecting the Red Sea with the Gulf of Aden. This development coincides with escalating military actions in the region, including conflicting claims between the U.S. Central Command and Iran's Islamic Revolutionary Guard Corps regarding strikes on vessels.
What the Numbers Show
The pipeline's 7 million bpd capacity represents a substantial portion of Saudi Arabia's export capability independent of the Strait of Hormuz. Any confirmed disruption to this single asset would force a significant rerouting of crude shipments, potentially tightening global supply constraints given the current geopolitical volatility.

How would a confirmed disruption of the 7 million bpd East-West pipeline impact global Brent crude prices in the short term?
What alternative export routes or storage strategies might Saudi Aramco deploy to mitigate supply losses if the pipeline is damaged?
Could Houthi control of Mocha lead to increased insurance premiums for commercial vessels transiting the Red Sea and Bab el-Mandeb Strait?
 15
15








 Access 50+ Readymade Screeners
  Use 200+ Custom Filters
  Get Full Market Insights





