Hindustan Zinc Shows Bearish Technical Signals After Double Top Formation


Hindustan Zinc Ltd has formed a bearish double top pattern, breaking below ₹605 support with volume confirmation. Technical indicators including RSI decline from 70 to 52.6, bearish MACD crossover, and moving average breakdown signal continued downward pressure. The world's largest integrated zinc producer has delivered strong returns of 20.3% monthly and 35.26% over six months despite current technical weakness.

*this image is generated using AI for illustrative purposes only.
Hindustan Zinc Ltd has exhibited a bearish reversal pattern on its 4-hour chart, signaling potential near-term downward momentum after experiencing a prolonged uptrend in recent trading sessions.
Double Top Pattern Formation
The stock has formed a double top pattern in the 4-hour timeframe, which represents a classic bearish reversal signal. This pattern is characterized by two peaks formed at roughly the same price level, separated by a moderate pullback, suggesting that buying pressure is weakening.
| Technical Parameter: | Details |
|---|---|
| Pattern Type: | Double Top Formation |
| Support Breakdown: | ₹605.00 |
| Timeframe: | 4-Hour Chart |
| Volume Confirmation: | Increased Selling Volumes |
On Thursday, the stock broke below the ₹605.00 support neckline after completing the double top formation. This breakdown, accompanied by increased selling volumes, confirms near-term bearish momentum and signals a potential shift from uptrend to downtrend.
Technical Indicator Analysis
Multiple technical indicators are confirming the bearish momentum across different timeframes:
RSI Analysis: The daily RSI shows clear bearish momentum, dropping significantly from 70 in the previous trading session to 52.60 on Thursday, confirming the continuation of the downtrend.
MACD Signals: The orange signal line has crossed above the blue MACD line, with the histogram turning red, indicating strengthening bearish momentum.
Moving Average Breakdown: On the 4-hour timeframe, the 5-day moving average has crossed below the 9-day moving average, providing additional confirmation of the bearish trend.
| Indicator: | Signal | Reading |
|---|---|---|
| Daily RSI: | Bearish | 52.60 (from 70) |
| MACD: | Bearish Crossover | Histogram Red |
| Moving Averages: | Bearish | 5-day below 9-day |
| Price Volume Trend: | Declining | Volume Confirmation |
Price Targets and Resistance Levels
The downside target for the double top pattern is calculated by measuring the distance between the peak level and the neckline, then projecting that distance downward from the breakdown point. On the upside, resistance is likely around ₹605.00, while sustained trading below the breakdown zone would signal continued bearish pressure.
Company Background
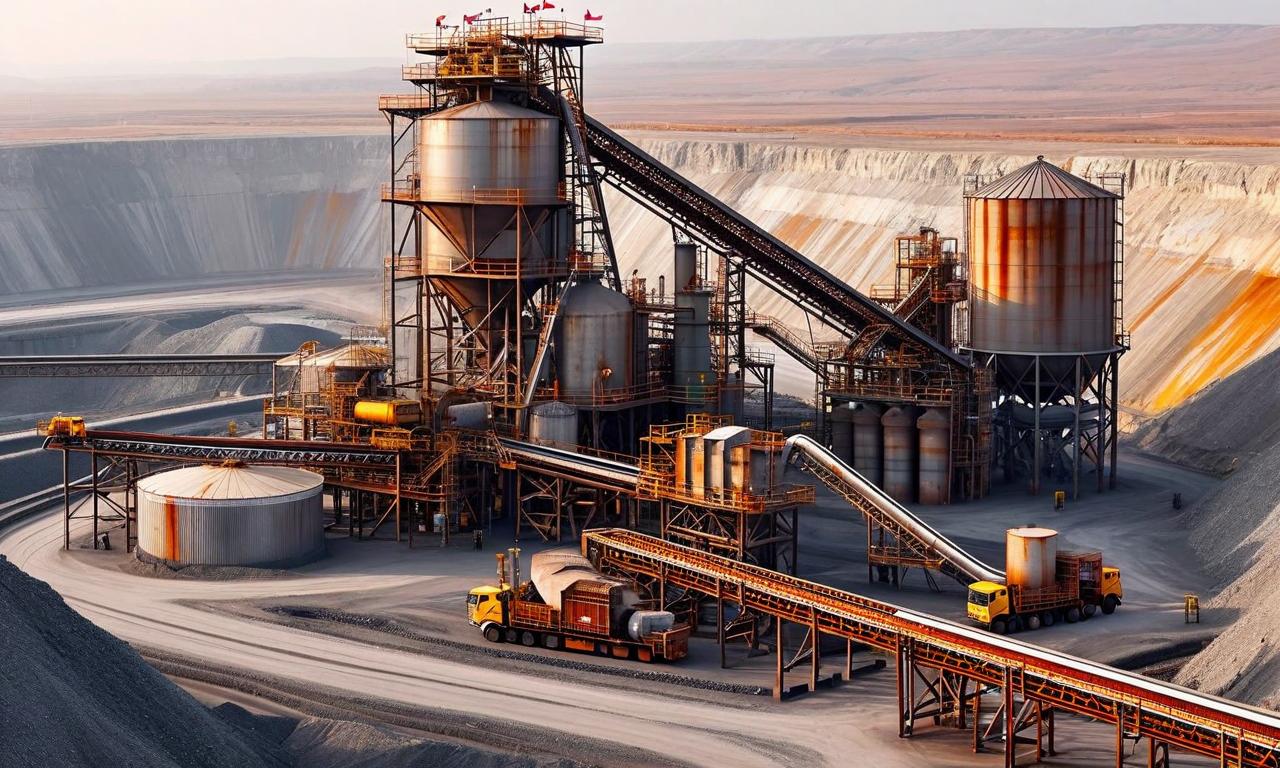
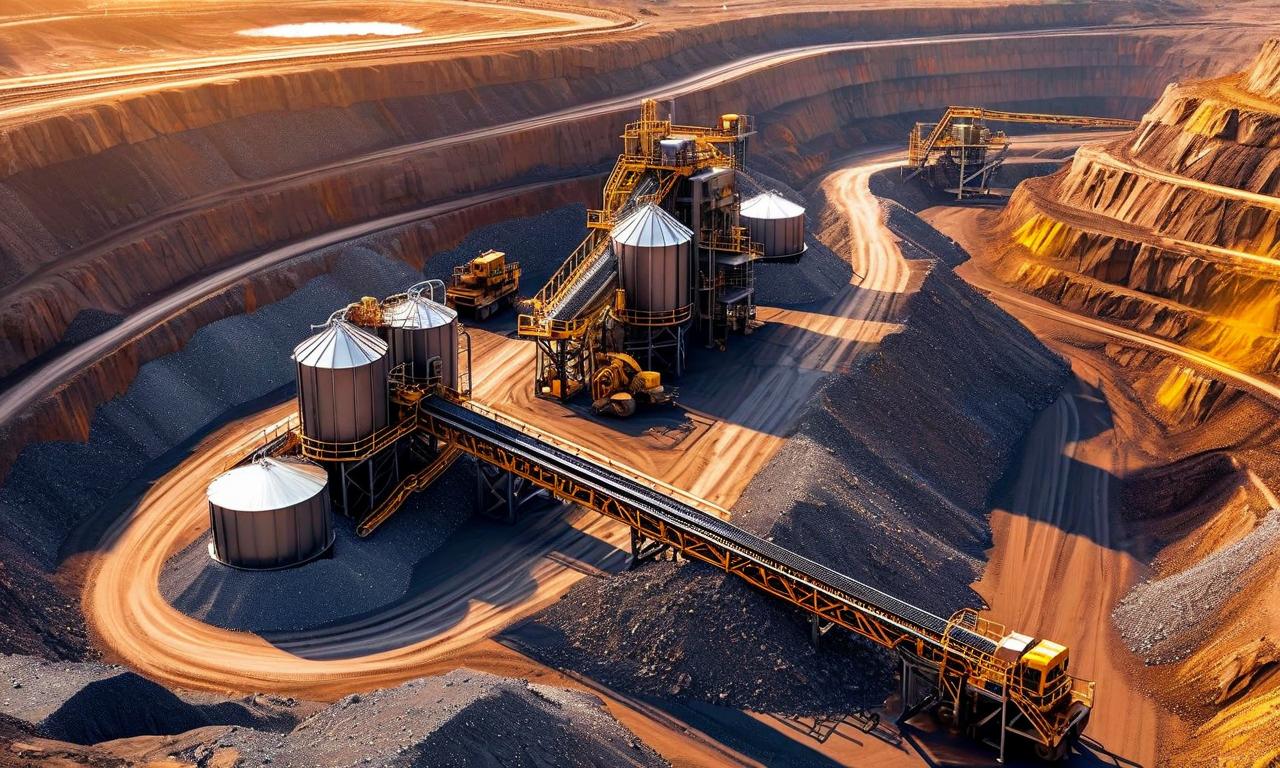
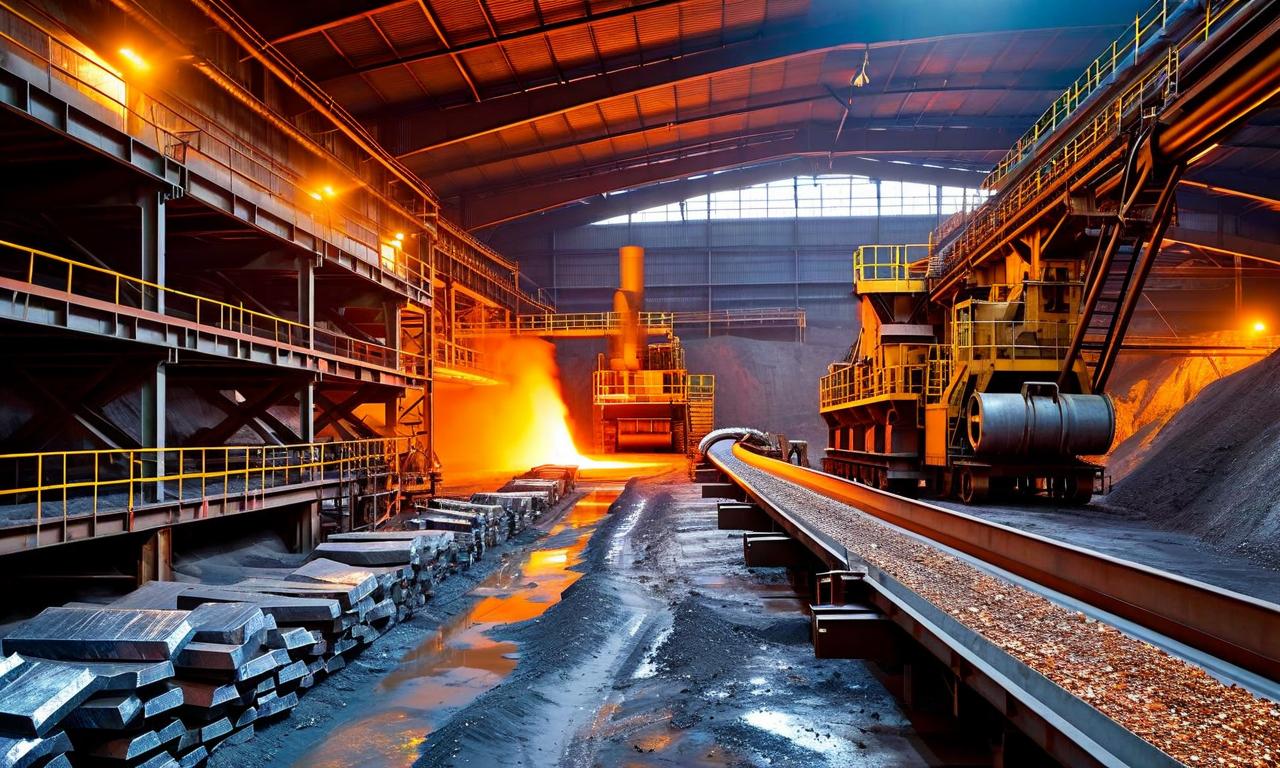
Hindustan Zinc Ltd, a Vedanta Group company, stands as the world's largest integrated zinc producer and ranks among the top five silver producers globally. The company exports to over 40 countries and commands approximately 77% share of India's primary zinc market.
| Performance Period: | Returns |
|---|---|
| Past Month: | 20.30% |
| Past Six Months: | 35.26% |
| Past Year: | 32.94% |
Despite the recent bearish technical formation, the stock has delivered strong performance over longer timeframes, with notable gains across monthly, semi-annual, and annual periods.
Historical Stock Returns for Hindustan Construction Company
| 1 Day | 5 Days | 1 Month | 6 Months | 1 Year | 5 Years |
|---|---|---|---|---|---|
| -2.99% | -7.14% | -17.94% | +12.19% | -4.83% | +117.32% |
 15
15