News Stocks Gokaldas Exports Welcomes India-EU FTA, Eyes Revenue Growth Despite US Tariff Challenges
Gokaldas Exports Welcomes India-EU FTA, Eyes Revenue Growth Despite US Tariff Challenges


Gokaldas Exports has welcomed the India-EU Free Trade Agreement as a positive development for textile exporters. The company expects its EU revenue share to grow from current 16-17% to 19-20% over the next 12 months. While operating at full capacity, management plans cautious capex due to 50% US tariffs that have compressed American export margins to low single digits. Despite tariff challenges, the company maintains strong US order pipeline through Q1 FY27, with overall margins expected in high single digit range.
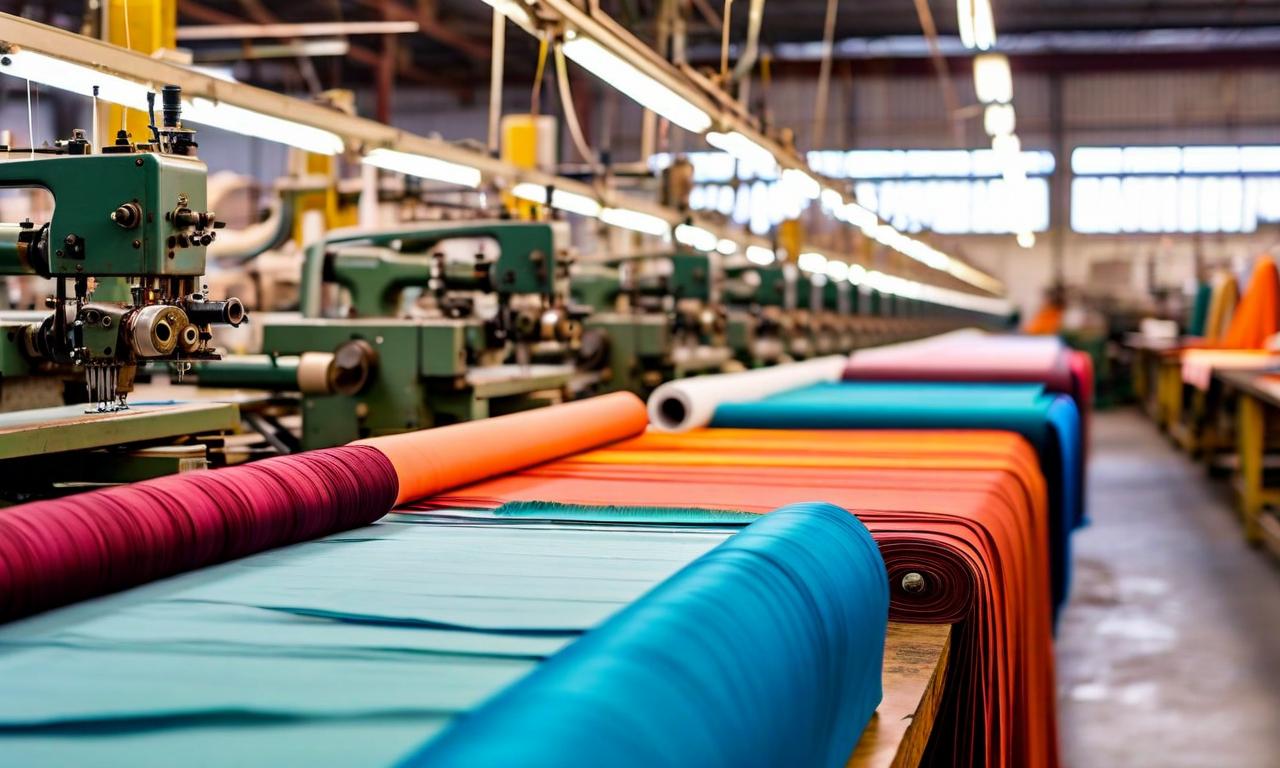

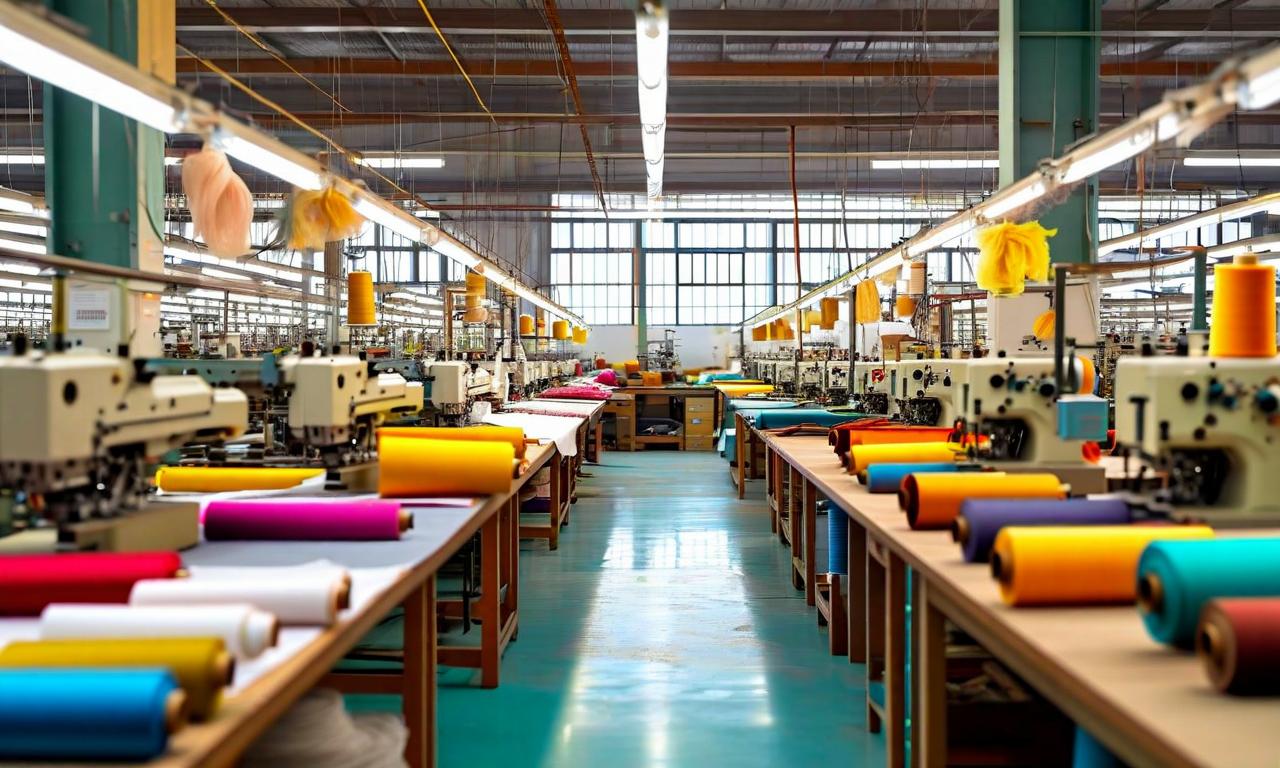
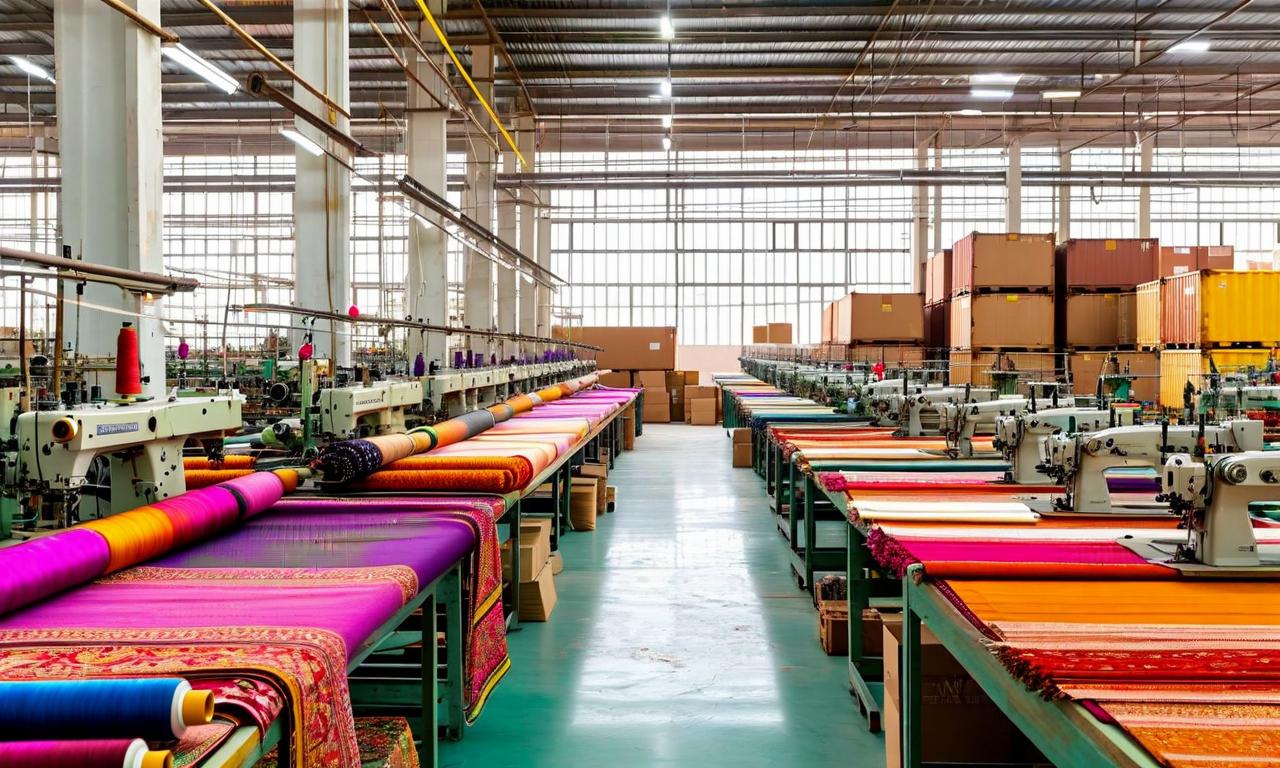
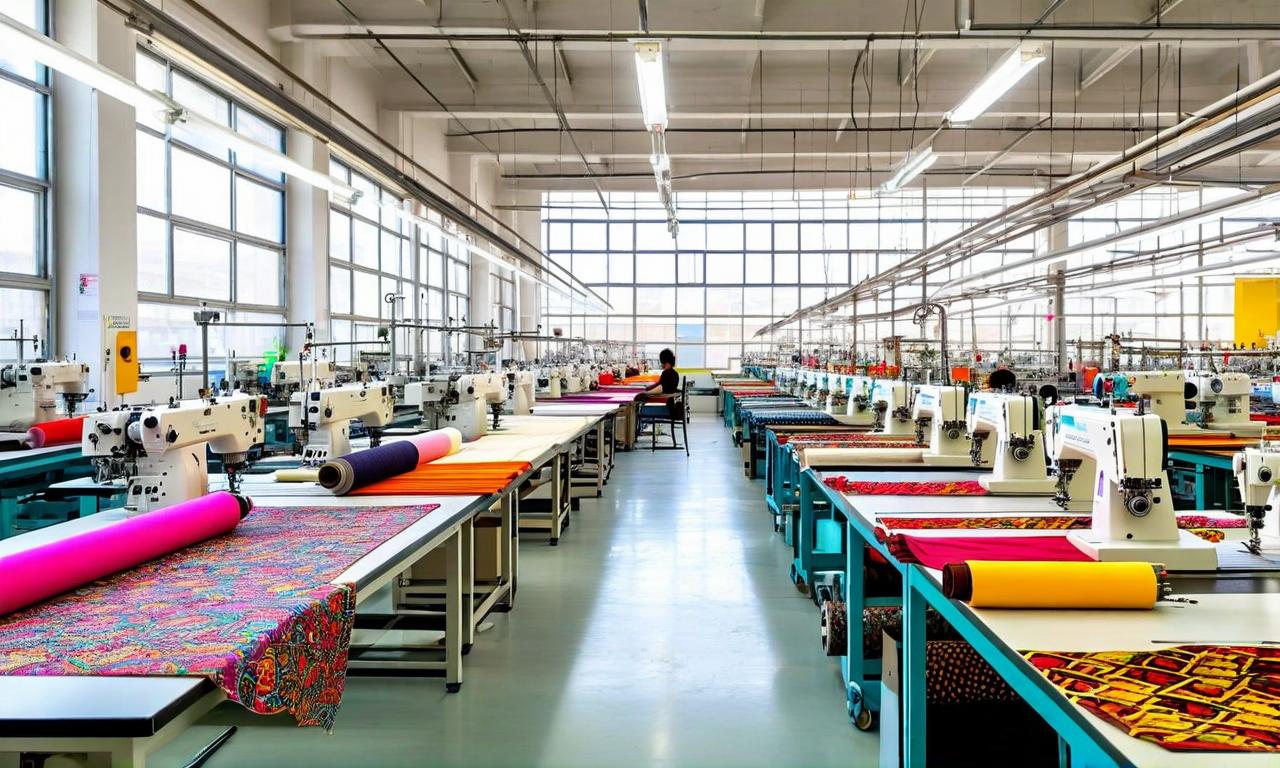
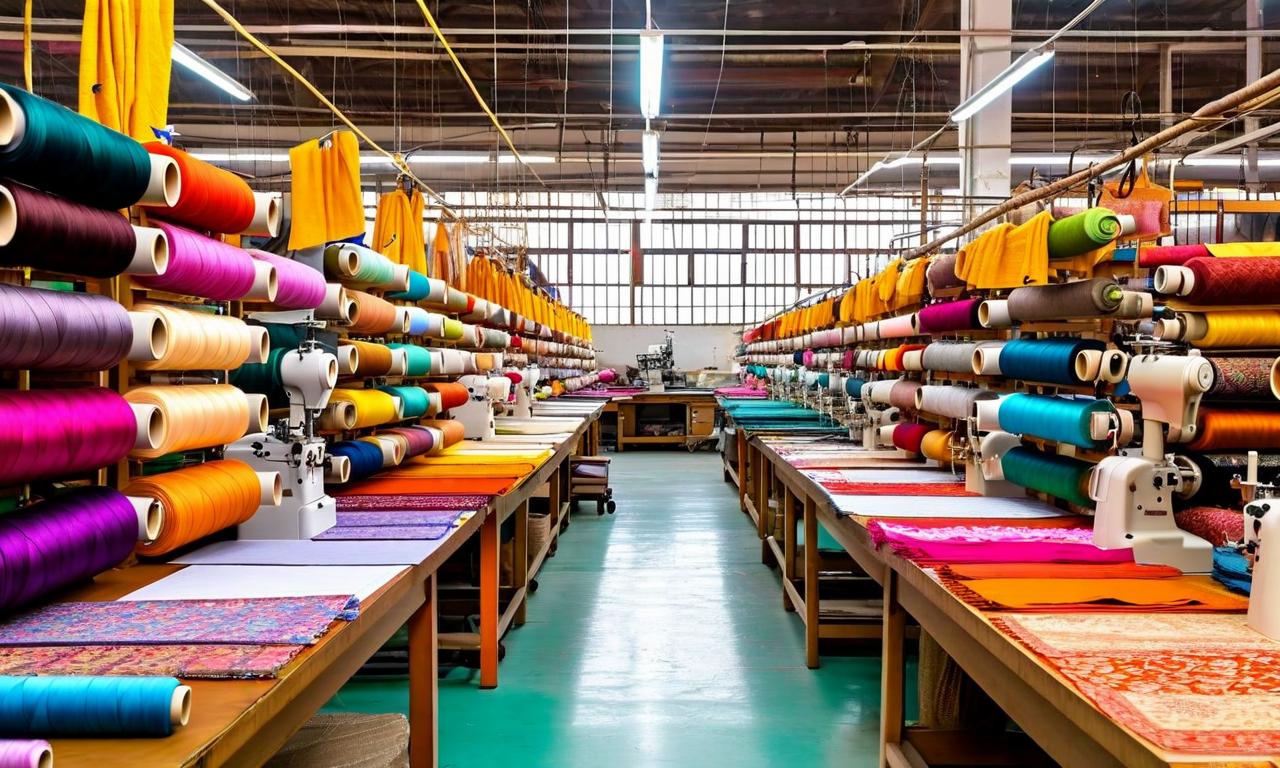
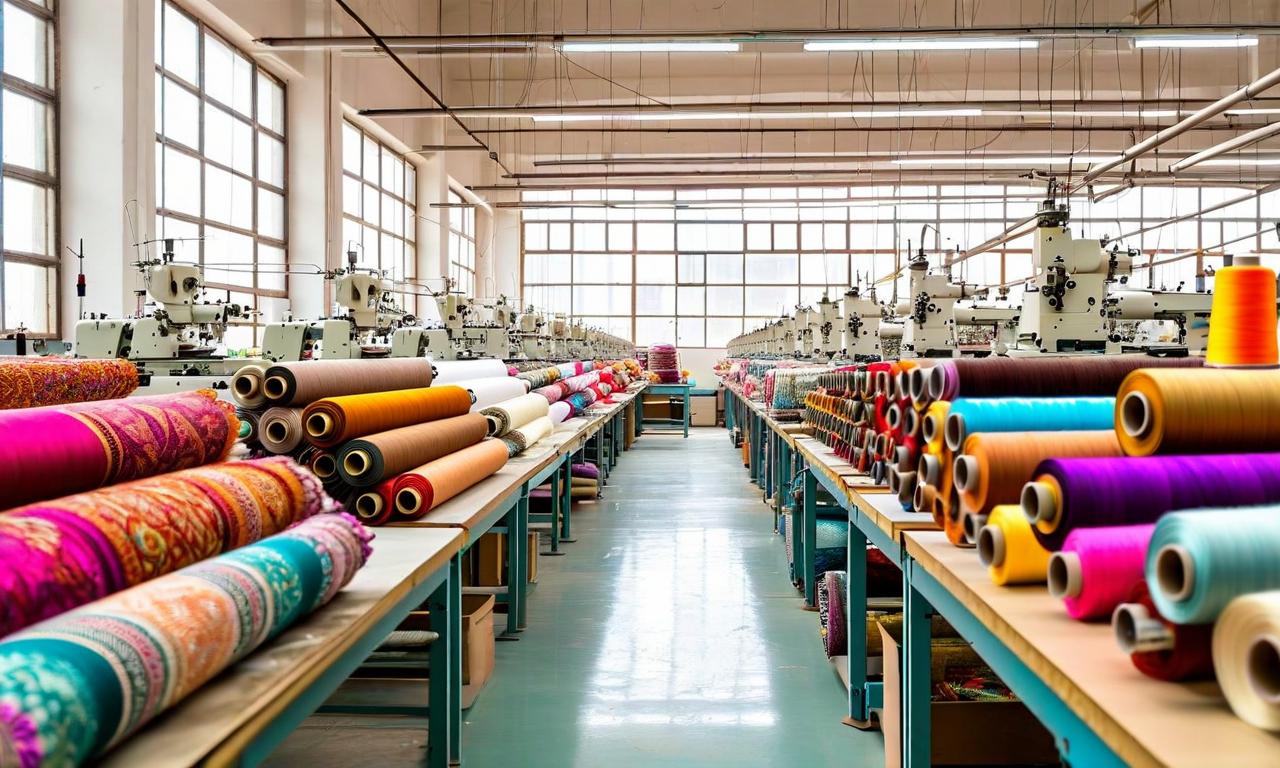
*this image is generated using AI for illustrative purposes only.
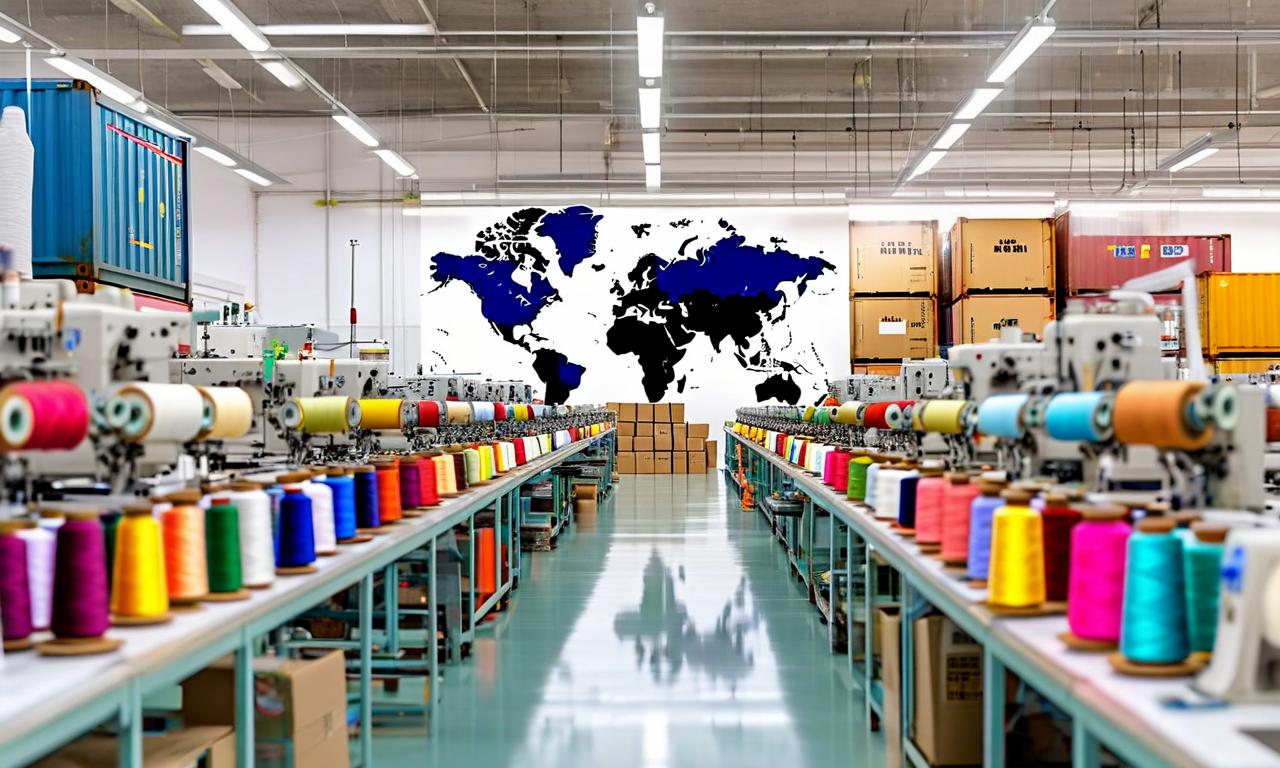
Gokaldas Exports , a prominent textile player and major exporter to the US and European Union, has expressed strong support for the Free Trade Agreement between India and the European Union. The company views this development as a significant positive step for Indian textile and apparel manufacturers.
During a management interaction with CNBC-TV18 on Tuesday, January 27, Vice Chairman and Managing Director Sivaramakrishnan Ganapathi emphasized the importance of this agreement, noting that both the US and European Union represent substantial markets for Indian textile exporters.
Current Market Exposure and Growth Projections
The company's revenue distribution shows heavy reliance on the US market, while European Union exposure currently accounts for a smaller but growing portion of business.
| Market Exposure: | Current | Projected (12 months) |
|---|---|---|
| European Union Share: | 16% to 17% | 19% to 20% |
| Revenue Source: | Annual topline | Overall topline |
Ganapathi expressed confidence that the EU revenue share will increase over the next 12 months, reflecting the company's strategic focus on diversifying its export markets.
Operational Capacity and Investment Strategy
Gokaldas Exports is currently operating at full capacity across all facilities. However, the company's capital expenditure approach reflects a cautious stance given current market conditions.
The management outlined their investment strategy:
- Current Status: Operating at full potential capacity
- Capex Approach: Slow and measured due to ongoing US tariff challenges
- Future Plans: Increased EU investments planned once FTA benefits materialize in 2027
- Margin Expectations: Anticipating improved margins on EU exports following FTA implementation
Impact of US Tariffs on Business Performance
Despite facing 50% tariffs on US exports, Gokaldas Exports maintains a robust order pipeline for the American market. The company's order book strength extends through the first quarter of financial year 2027, with additional orders flowing in for the second quarter.
| Impact Area: | Details |
|---|---|
| Order Pipeline: | Strong through Q1 FY27 |
| Additional Orders: | Coming in for Q2 |
| US Export Margins: | Low single digits |
| Overall Margins: | High single digit range |
| Tariff Rate: | 50% on US exports |
While the order book remains resilient, margins have experienced significant pressure. US export margins have compressed to low single digits due to the tariff burden, though overall company margins are expected to remain in the high single digit range.
Trade Agreement Benefits and Market Outlook
Under the India-EU FTA framework, several Indian export categories will benefit from zero tariffs, including marine products, chemicals, textiles, footwear, consumer goods, base metals, and sporting goods. This comprehensive coverage positions textile exporters like Gokaldas Exports to capitalize on enhanced market access.
The company is yet to announce its December quarter results, which will represent the first complete quarter reflecting the full impact of 50% US export tariffs.
Stock Performance
Gokaldas Exports shares declined 7.50% during last Friday's market sell-off and have experienced significant correction from recent highs, falling approximately 50% from the 52-week high of ₹1,060.
Historical Stock Returns for Gokaldas Exports
| 1 Day | 5 Days | 1 Month | 6 Months | 1 Year | 5 Years |
|---|---|---|---|---|---|
| -2.57% | -10.19% | -31.55% | -40.66% | -47.43% | +534.15% |
 18
18