PTC Industries sets ₹22,150 floor price for QIP launch on October 6

scanx
Reviewed by
Shraddha JScanX News Team
Key Highlights
  • Floor price for QIP fixed at ₹22,150 per equity share
  • Issue opens on October 6, 2026, for qualified institutional buyers
  • Discount of up to 5% on floor price permitted under SEBI rules
  • Face value of equity shares offered is ₹10 each
powered bylight_fuzz_icon
52852388

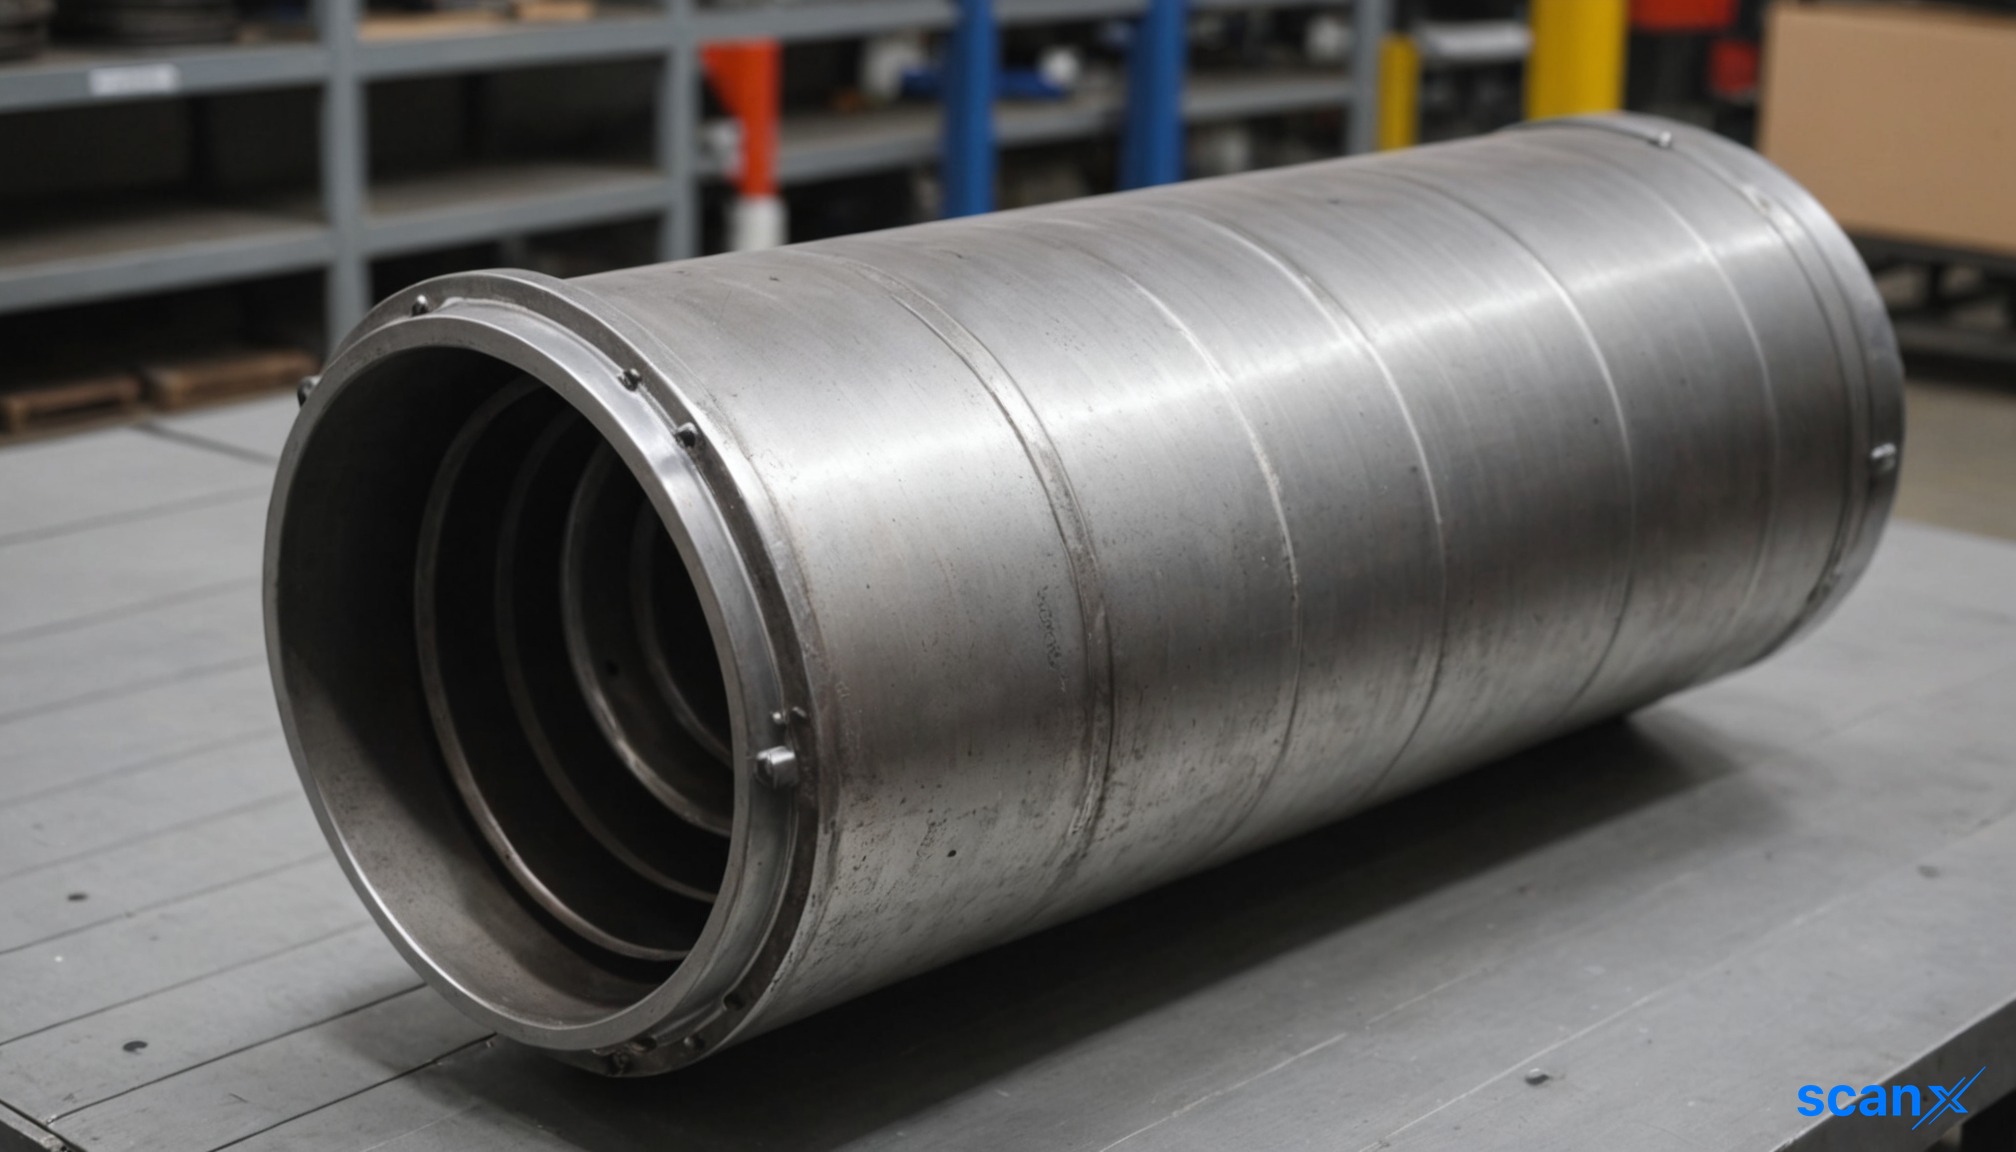
*this image is generated using AI for illustrative purposes only.

PTC Industries Limited has set a floor price of ₹22,150 per equity share for its upcoming Qualified Institutional Placement (QIP). The Listing and Fund Raising Committee approved the pricing and authorized the opening of the issue on October 6, 2026.

The company will offer equity shares with a face value of ₹10 each to qualified institutional buyers. This capital raise follows approvals from the Board of Directors and shareholders. The special resolution was passed at an extraordinary general meeting held on August 1, 2026.

Pricing and regulatory framework

The floor price was determined in accordance with Regulation 176(1) of the Securities and Exchange Board of India (Issue of Capital and Disclosure Requirements) Regulations, 2018. The relevant date for determining this price was fixed as October 6, 2026.

Under SEBI guidelines, PTC Industries may offer a discount of not more than 5% on the floor price. The final issue price will be decided by the company in consultation with the book running lead managers appointed for the placement.

Key details of the QIP

Parameter Detail
Issue Type Qualified Institutional Placement
Floor Price ₹22,150 per share
Face Value ₹10 per share
Issue Opening Date October 6, 2026
Maximum Discount 5%

The preliminary placement document dated October 6, 2026, will be filed with both BSE Limited and National Stock Exchange of India Limited. The committee meeting to approve these terms commenced at 9:30 pm and concluded at 10:15 pm on the same day.

This action complies with Regulation 29(1) and 30 of the Securities and Exchange Board of India (Listing Obligations and Disclosure Requirements) Regulations, 2015. The company’s Board initially accorded approval for the fund-raising exercise during meetings held on June 27, 2026, and September 5, 2026.

Historical Stock Returns for PTC Industries

1 Day5 Days1 Month6 Months1 Year5 Years
+2.64%+6.64%-2.96%+57.04%+38.91%+653.22%

How will the capital raised from this QIP be allocated across PTC Industries' specific defense and aerospace projects?

What is the expected dilution impact on existing shareholders given the high floor price of ₹22,150?

How does this institutional placement align with PTC Industries' current order book backlog and future capacity expansion plans?

PTC Industries Q1FY27 revenue rises 97% to ₹192 crore

scanx
Reviewed by
Suketu GScanX News Team
Key Highlights
  • Consolidated revenue rose 97.4% YoY to ₹1,918.0 crore in Q1FY27
  • Net profit jumped 466.2% to ₹291.9 crore from ₹51.6 crore
  • EBITDA expanded 180.1% to ₹542.1 crore, boosting margins
  • Operating cash flow swung positive to ₹442.5 crore from negative ₹345.4 crore
  • Other income declined 49.7% to ₹53.2 crore due to lower interest and forex gains
powered bylight_fuzz_icon
52772596

*this image is generated using AI for illustrative purposes only.

PTC Industries reported a 97.4% year-on-year increase in consolidated revenue from operations to ₹1,918.0 crore (₹19,179.75 lakh) for the quarter ended June 30, 2026. The significant growth was driven by a surge in sales of products to ₹1,906.8 crore from ₹961.4 crore in the corresponding period last year.

The company’s profit before tax stood at ₹367.5 crore (₹3,674.65 lakh), up 305.9% from ₹90.5 crore (₹905.42 lakh) in Q1FY26. Net profit for the period rose to ₹291.9 crore (₹2,919.27 lakh) from ₹51.6 crore (₹515.56 lakh), marking a substantial improvement in bottom-line performance.

Financial performance highlights

The strong top-line growth translated into improved margins, with EBITDA (Profit before finance cost, depreciation and amortisation) rising to ₹542.1 crore (₹5,421.27 lakh) from ₹193.5 crore (₹1,935.21 lakh). The EBITDA margin expanded significantly as revenue nearly doubled while cost of materials consumed increased at a slower pace relative to the revenue jump.

Metric Q1FY27 (₹ lakh) Q1FY26 (₹ lakh) Change (%)
Revenue from operations 19,179.75 9,714.63 +97.4
Total income 19,711.34 10,771.32 +83.0
EBITDA 5,421.27 1,935.21 +180.1
Profit before tax 3,674.65 905.42 +305.9
Net Profit 2,919.27 515.56 +466.2
EPS (Basic, ₹) 19.47 3.44 +466.0

What the numbers show

A key divergence is visible between the robust operational growth and the decline in other income. While operating revenue surged by 97.4%, other income fell 49.7% to ₹53.2 crore (₹531.59 lakh) from ₹105.7 crore (₹1,056.69 lakh). This reduction was primarily due to lower interest income from bank deposits, which dropped to ₹33.6 crore from ₹63.1 crore, and a decrease in net foreign exchange gains. Despite this headwind, the core business momentum was strong enough to drive a massive expansion in pre-tax profits.

Balance sheet and cash flow trends

The company’s total assets grew to ₹1,999.9 crore (₹1,99,987.24 lakh) from ₹1,956.2 crore (₹1,95,624.67 lakh) as on March 31, 2026. Non-current assets expanded notably, driven by an increase in capital work-in-progress to ₹358.9 crore and other financial assets to ₹76.5 crore. Current assets decreased slightly to ₹809.4 crore, largely due to a reduction in trade receivables to ₹241.7 crore from ₹273.9 crore.

Operating cash flow turned positive, generating ₹442.5 crore (₹4,424.98 lakh) compared to a negative outflow of ₹345.4 crore (₹3,454.20 lakh) in the same period last year. This shift reflects improved working capital management, particularly in receivables collection, alongside higher profitability.

QIP context

This financial information has been prepared specifically for inclusion in the placement document for a proposed Qualified Institutions Placement (QIP) of equity shares. The Board approved these special purpose condensed interim consolidated financial statements on October 5, 2026, to comply with SEBI ICDR Regulations, 2018.

Historical Stock Returns for PTC Industries

1 Day5 Days1 Month6 Months1 Year5 Years
+2.64%+6.64%-2.96%+57.04%+38.91%+653.22%

How will the proceeds from the proposed Qualified Institutions Placement (QIP) be allocated to support the ongoing capital work-in-progress and future capacity expansion?

Is the near-doubling of revenue driven by sustainable long-term order book visibility or temporary spikes in demand within the aerospace and defense sectors?

What is the sustainability of the improved EBITDA margins given that cost of materials consumed grew at a slower pace than revenue, and how might raw material volatility impact future quarters?

More News on PTC Industries

1 Year Returns:+38.91%