NewsZen Technologies Reports 48% Revenue Decline in Q2, Maintains Strong Margins Despite Order Delays
Zen Technologies Reports 48% Revenue Decline in Q2, Maintains Strong Margins Despite Order Delays


Zen Technologies experienced a 48% year-over-year revenue decline in Q2 FY2026, with revenue dropping to Rs. 124.65 crores from Rs. 241.69 crores. Despite this, the company improved its profitability, with EBITDA margin rising to 52% from 36% and PAT margin increasing to 37% from 27%. The revenue decline was attributed to delayed orders. The company's current order book stands at Rs. 675 crores, with expectations of delayed simulator orders worth Rs. 650 crores materializing in H2. Zen Technologies maintains its cumulative revenue guidance of Rs. 6,000 crores by FY2028 and focuses on simulators and anti-drone systems as its main product lines. The company remains debt-free with a net cash position of Rs. 1,103 crores.


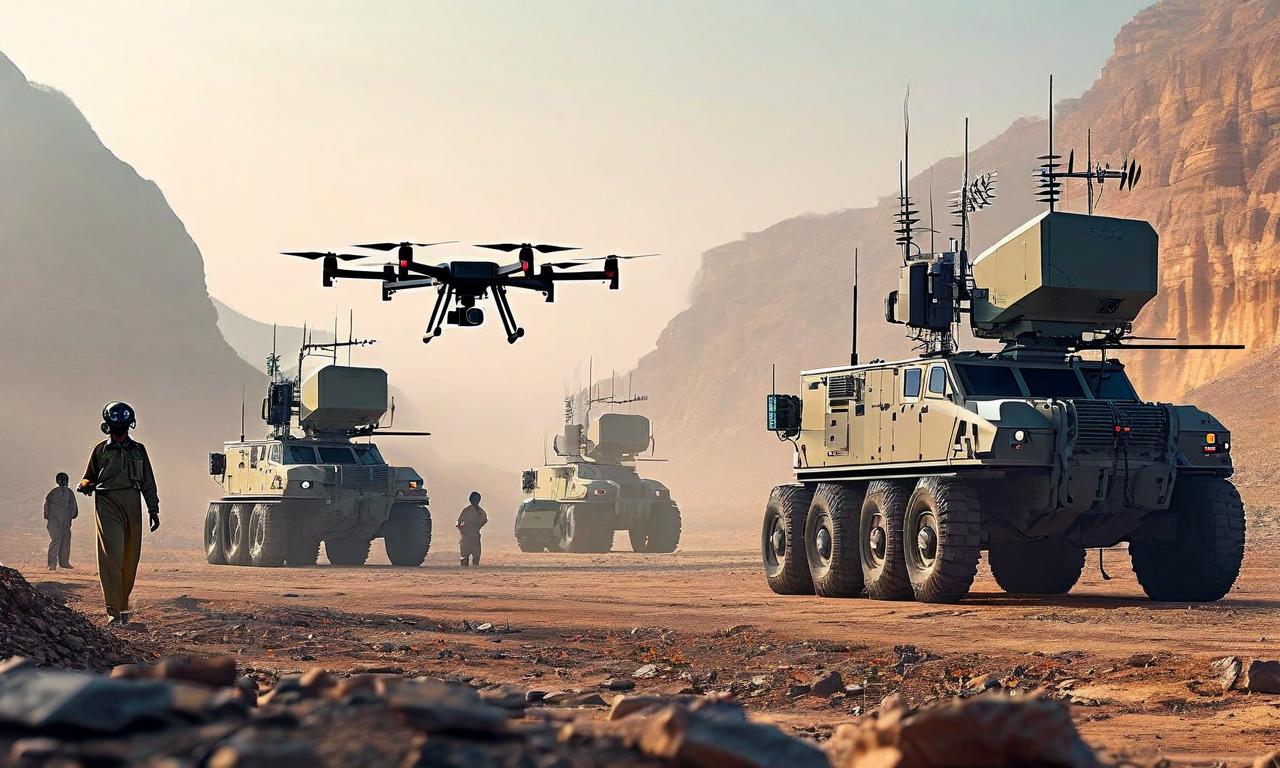
*this image is generated using AI for illustrative purposes only.
Zen Technologies , a leading defense technology company, reported a significant revenue decline in Q2 but maintained healthy profit margins amidst order delays. The company remains optimistic about its long-term prospects in the defense sector, particularly in simulators and anti-drone systems.
Financial Performance
For Q2, Zen Technologies reported:
| Metric | Q2 FY2026 | Q2 FY2025 | YoY Change |
|---|---|---|---|
| Revenue | Rs. 124.65 crores | Rs. 241.69 crores | -48% |
| EBITDA | Rs. 64.79 crores | Rs. 87.84 crores | -26% |
| EBITDA Margin | 52% | 36% | +16 percentage points |
| Profit After Tax | Rs. 46.16 crores | Rs. 65.24 crores | -29% |
| PAT Margin | 37% | 27% | +10 percentage points |
Despite the revenue decline, Zen Technologies maintained strong profitability, with EBITDA and PAT margins showing significant improvement year-over-year.
Order Book and Future Outlook
The company attributed the revenue decline to delayed orders, as the government focused on emergency procurement post-Operation Sindoor. Key points include:
- Current order book stands at Rs. 675 crores, with Rs. 375 crores for equipment and the remainder for Annual Maintenance Contracts (AMC).
- Management expects delayed simulator orders worth Rs. 650 crores to materialize in H2.
- The company maintains its cumulative revenue guidance of Rs. 6,000 crores by FY2028, with expected acceleration in orders during FY2027-2028.
Product Focus and Market Opportunities
Zen Technologies is concentrating on two main product lines:
- Simulators: Targeting domestic and international markets across all three armed services.
- Anti-Drone Systems: Seeing strong demand post-Operation Sindoor, with a focus on both Indian armed forces and exports to friendly nations.
The company expects a roughly 50-50 split between simulators and anti-drone systems in its future revenue mix.
R&D and Competitive Edge
Zen Technologies emphasized its focus on indigenous R&D and IP ownership, particularly in anti-drone systems. The company claims to offer comprehensive solutions, including both soft kill and hard kill capabilities, which it believes gives it a competitive advantage in the market.
Financial Position
As of September 30, 2025, Zen Technologies maintains a strong net cash position of Rs. 1,103 crores and remains debt-free.
Management Commentary
Ashok Atluri, Chairman and Managing Director, stated, "The long-term story is intact. Companies with indigenous R&D, their own IP, with long-term game plans and a lot of products in the pipeline are the ones that are going to survive for the long term."
While acknowledging the current challenges, management remains confident about the company's future prospects, particularly in FY2027 and FY2028, citing a strong pipeline in both simulators and anti-drone systems.
Conclusion
Despite facing short-term headwinds, Zen Technologies maintains a positive outlook on its long-term growth prospects. The company's focus on indigenous technology development and its strong financial position provide a solid foundation for future growth in the evolving defense technology landscape.
Historical Stock Returns for Zen Technologies
| 1 Day | 5 Days | 1 Month | 6 Months | 1 Year | 5 Years |
|---|---|---|---|---|---|
| -0.68% | +0.20% | -7.94% | +37.78% | -5.23% | +1,727.31% |
 18
18