Vamshi Rubber Q3FY26 Results: Net Profit ₹11.68 Lakhs, Revenue ₹1,885.87 Lakhs


Vamshi Rubber Limited announced Q3FY26 results showing net profit of ₹11.68 lakhs on revenue of ₹1,885.87 lakhs, with quarterly revenue declining but maintaining profitability. Nine-month performance demonstrated strong growth with net profit increasing 65.29% to ₹73.62 lakhs and EPS rising 93.40% to ₹2.05, while the company maintains zero debt and strong financial health.

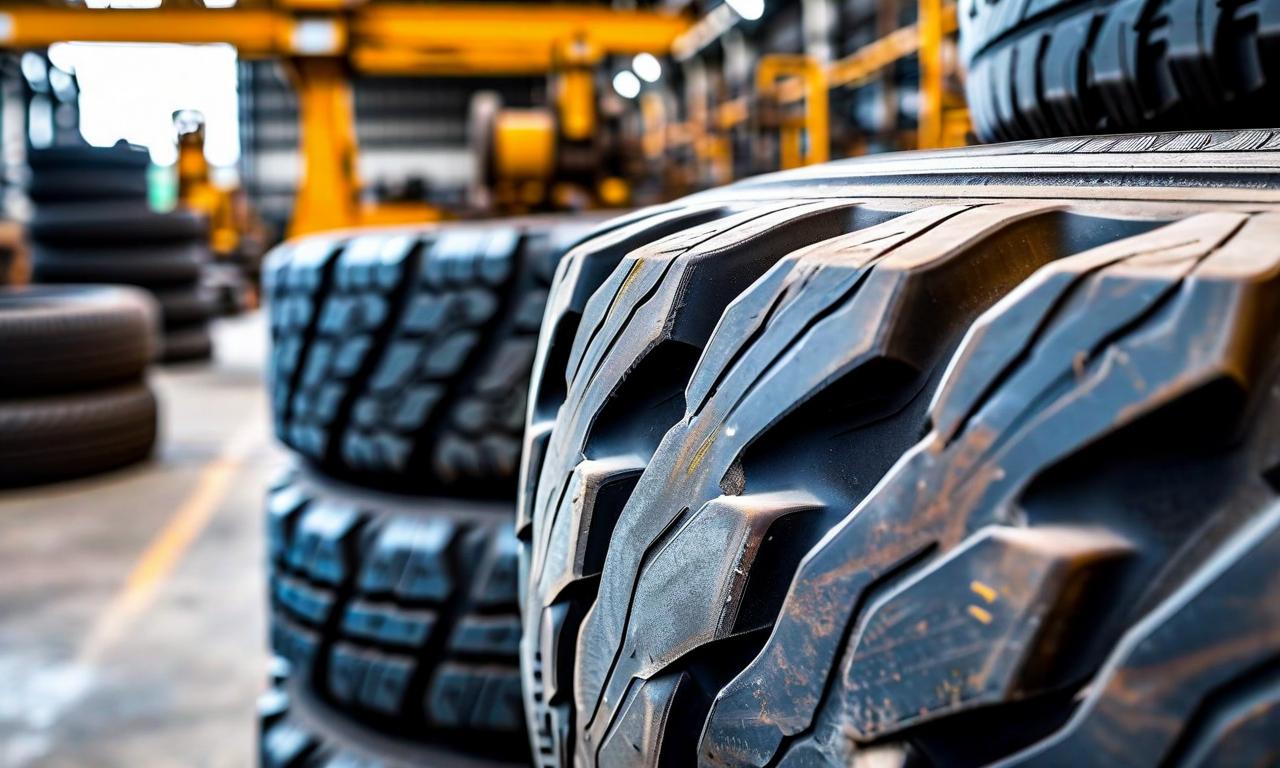
*this image is generated using AI for illustrative purposes only.
Vamshi Rubber Limited announced its unaudited financial results for the third quarter of fiscal year 2026, ending December 31, 2025. The company reported a net profit of ₹11.68 lakhs on revenue of ₹1,885.87 lakhs for the quarter, demonstrating resilient performance in challenging market conditions.
Quarterly Financial Performance
The company's Q3FY26 results show mixed performance compared to previous periods. While quarterly revenue declined from ₹2,315.88 lakhs in Q2FY26 to ₹1,885.87 lakhs, the company maintained profitability with improved margins.
| Financial Metric | Q3FY26 | Q2FY26 | Q3FY25 | Change (QoQ) | Change (YoY) |
|---|---|---|---|---|---|
| Revenue | ₹1,885.87 lakhs | ₹2,315.88 lakhs | ₹2,046.44 lakhs | -18.58% | -7.85% |
| Net Profit | ₹11.68 lakhs | ₹34.30 lakhs | ₹9.12 lakhs | -65.95% | +28.07% |
| Total Expenses | ₹1,887.70 lakhs | ₹2,289.32 lakhs | ₹2,041.32 lakhs | -17.54% | -7.53% |
| Profit Before Tax | ₹8.23 lakhs | ₹36.30 lakhs | ₹10.81 lakhs | -77.33% | -23.87% |
Nine-Month Performance Analysis
The nine-month period ending December 31, 2025, showcased stronger overall performance with significant year-over-year improvements in profitability metrics.
| Nine-Month Metrics | FY26 | FY25 | Growth (%) |
|---|---|---|---|
| Total Revenue | ₹6,544.23 lakhs | ₹6,601.29 lakhs | -0.86% |
| Net Profit | ₹73.62 lakhs | ₹44.53 lakhs | +65.29% |
| Total Comprehensive Income | ₹86.34 lakhs | ₹44.53 lakhs | +93.90% |
| Earnings Per Share (Basic) | ₹2.05 | ₹1.06 | +93.40% |
Cost Structure and Operational Efficiency
The company's cost management strategies reflected in the expense breakdown for Q3FY26. Material costs constituted the largest expense component at ₹1,290.12 lakhs, representing 68.40% of total revenue.
| Expense Category | Q3FY26 Amount | % of Revenue |
|---|---|---|
| Cost of Materials Consumed | ₹1,290.12 lakhs | 68.40% |
| Employee Benefits | ₹320.51 lakhs | 17.00% |
| Other Operating Expenses | ₹249.36 lakhs | 13.22% |
| Finance Costs | ₹44.36 lakhs | 2.35% |
| Depreciation | ₹22.06 lakhs | 1.17% |
Financial Position and Debt Status
Vamshi Rubber maintains a debt-free status with zero outstanding loans from banks or financial institutions. The company reported no defaults on any financial obligations, demonstrating strong financial discipline and liquidity management.
| Financial Health Indicator | Status |
|---|---|
| Total Outstanding Debt | ₹0 crore |
| Default Amount | ₹0 crore |
| Paid-up Equity Share Capital | ₹420.68 lakhs |
| Reserves (Previous Year) | ₹1,119.19 lakhs |
Regulatory Compliance and Governance
The financial results were reviewed by the Audit Committee and approved by the Board of Directors during their meeting held on February 12, 2026. The results have been prepared in accordance with Indian Accounting Standards (Ind AS) and comply with SEBI Listing Obligations and Disclosure Requirements Regulations, 2015. Independent auditors M/S. Samudrala K & Co. LLP conducted the statutory review, confirming compliance with regulatory requirements and accounting standards.
Historical Stock Returns for Vamshi Rubber
| 1 Day | 5 Days | 1 Month | 6 Months | 1 Year | 5 Years |
|---|---|---|---|---|---|
| +0.13% | -4.53% | -3.15% | -10.71% | -27.44% | +102.02% |
 15
15