NewsSharda Motor Industries Reports 27.8% Revenue Growth in Q3FY26, Makes Conference Call Recording Available
Sharda Motor Industries Reports 27.8% Revenue Growth in Q3FY26, Makes Conference Call Recording Available


Sharda Motor Industries delivered robust Q3FY26 performance with revenue growing 27.8% year-on-year to ₹88,155.02 lakh while maintaining healthy profitability despite exceptional charges. The company secured major new orders worth over $200 million lifetime value, announced expansion plans for a new Haridwar facility, and has made its quarterly earnings conference call recording available to investors and analysts on the company website.

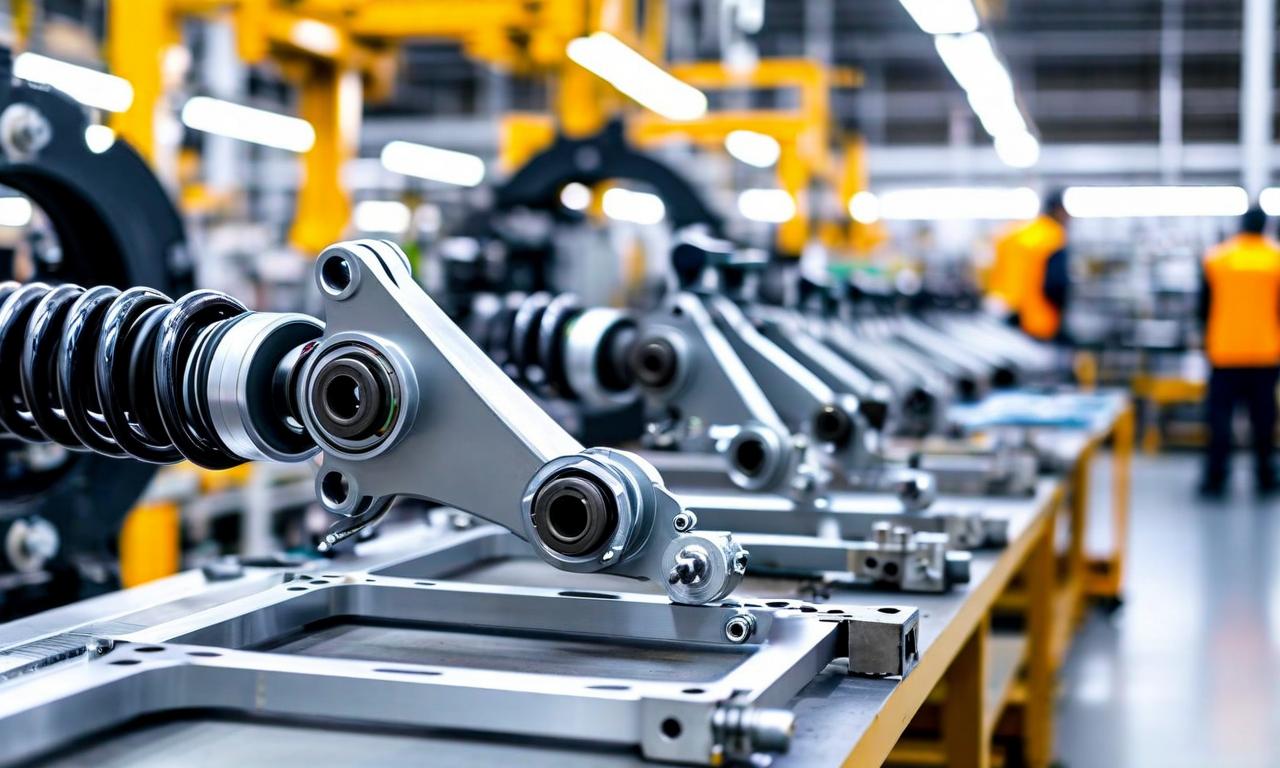
*this image is generated using AI for illustrative purposes only.
Sharda Motor Industries Limited has delivered strong financial results for the third quarter ended December 31, 2025, demonstrating robust growth across key performance metrics. The auto component manufacturer reported significant revenue expansion and maintained healthy profitability despite facing some exceptional charges during the quarter.
Strong Revenue Performance
The company achieved impressive top-line growth with revenue from operations reaching ₹88,155.02 lakh in Q3FY26, marking a substantial 27.8% increase compared to ₹68,999.47 lakh in Q3FY25. This growth momentum was supported by strong demand across the company's product portfolio and effective market positioning.
| Metric: | Q3FY26 | Q3FY25 | Growth (%) |
|---|---|---|---|
| Revenue from Operations: | ₹88,155.02 lakh | ₹68,999.47 lakh | +27.8% |
| Other Income: | ₹2,205.05 lakh | ₹2,087.89 lakh | +5.6% |
| Total Income: | ₹90,360.07 lakh | ₹71,087.36 lakh | +27.1% |
Profitability Analysis
Despite facing exceptional charges of ₹446.13 lakh related to employee benefit provisions, the company maintained solid profitability. Net profit for Q3FY26 stood at ₹8,013.01 lakh, representing a 7.2% increase from ₹7,472.02 lakh in the corresponding quarter of the previous year. The company's profit from operations before exceptional items and tax reached ₹11,041.90 lakh, up 10.4% year-on-year.
| Financial Metric: | Q3FY26 | Q3FY25 | Change (%) |
|---|---|---|---|
| Profit Before Tax: | ₹10,595.77 lakh | ₹10,005.27 lakh | +5.9% |
| Net Profit: | ₹8,013.01 lakh | ₹7,472.02 lakh | +7.2% |
| Basic EPS: | ₹13.96 | ₹13.02 | +7.2% |
Nine-Month Performance
For the nine-month period ended December 31, 2025, the company demonstrated consistent growth with revenue from operations increasing 16.2% to ₹2,42,500.75 lakh from ₹2,08,671.69 lakh in the previous year. Nine-month net profit grew 10.7% to ₹25,462.54 lakh, reflecting the company's ability to maintain margin discipline while scaling operations.
Manufacturing Expansion Initiative
The company announced plans to establish a new manufacturing unit in Haridwar, Uttarakhand, representing a significant capacity expansion initiative. The facility will add 1,50,000 sets per annum to the company's production capacity, with modular design allowing for future augmentation with limited capital expenditure.
| Expansion Details: | Specifications |
|---|---|
| Location: | Haridwar, Uttarakhand |
| Investment: | Approximately ₹20.00 crore |
| Capacity Addition: | 1,50,000 sets per annum |
| Funding Source: | Internal accruals |
| Expected Commencement: | July 2026 |
Major New Order Wins
The company has secured significant new orders across its business verticals, strengthening its growth trajectory. These orders span emission control systems, lightweighting solutions, and global business segments, with combined lifetime value exceeding $200 million.
| Order Category: | Annual Value | Lifetime Value | SOP Timeline |
|---|---|---|---|
| Suspension Control Arms: | $4.0 million | $22.0 million | Q3 FY26 Started |
| Global Emission Components: | $7.0 million | $40.0 million | Q2 FY27 |
| Lightweighting Solutions: | $8.3 million | $41.7 million | Q1 FY28 |
| Heavy Industry Emissions: | $4.8 million | $24.0 million | Q4 FY27 |
Strategic Business Expansion
Sharda Motor has strengthened its lightweighting vertical through a technology licensing agreement with Donghee Industrial Co. Ltd., South Korea. This partnership expands the company's suspension portfolio to include control arms, links, subframes, and torsion beams, increasing content per vehicle from the current ₹2,000-8,000 to ₹6,000-18,000.
Conference Call Recording Available
Following the investor and analyst conference call held on February 09, 2026, at 05:00 P.M. (IST) to discuss the Q3FY26 financial performance, the company has made the audio recording available on its website. The recording provides detailed insights into the operational and financial performance for the quarter ended December 31, 2025.
| Conference Call Details: | Information |
|---|---|
| Date: | February 09, 2026 |
| Time: | 05:00 P.M. (IST) |
| Purpose: | Q3FY26 Financial Performance Discussion |
| Availability: | Company website |
Exceptional Items Impact
The quarter included exceptional charges of ₹446.13 lakh primarily related to employee benefit provisions arising from new Labour Code implementations. These provisions covered gratuity revisions of ₹367.76 lakh and long-term compensated absences of ₹78.37 lakh, reflecting the company's proactive approach to regulatory compliance.
Historical Stock Returns for Sharda Motor
| 1 Day | 5 Days | 1 Month | 6 Months | 1 Year | 5 Years |
|---|---|---|---|---|---|
| +1.86% | +7.39% | +2.13% | +4.92% | -15.57% | +169.18% |
 17
17